Visual Wave Diagnostics and Analysis
To help provide users more visibility into wave run details such as status and volume, we’ve added a new Log Summary button now accessible from the Wave Inquiry UI.
From the Wave Inquiry UI, you can select the waves to be included in the analysis and when you click the Log Summary button, a log summary report (in PDF format) is generated in a background job. Once the report is ready, the download link for it is sent to the user in the email (similar to how export to CSV functionality works).
We analyze the wave logs along with wave data such as frequency and total time and displays a visual indicator by size in the report.
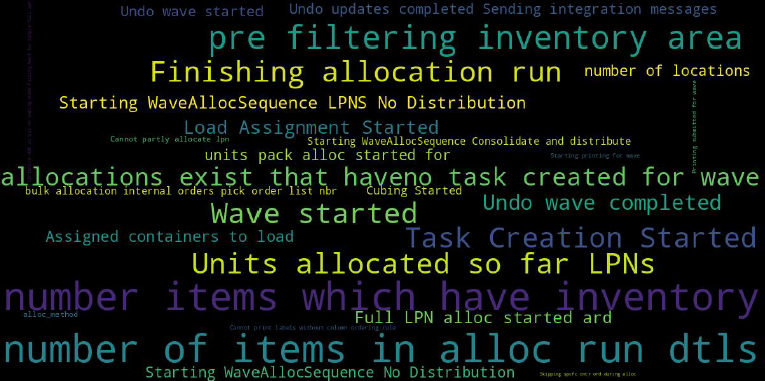
Visual Indicator
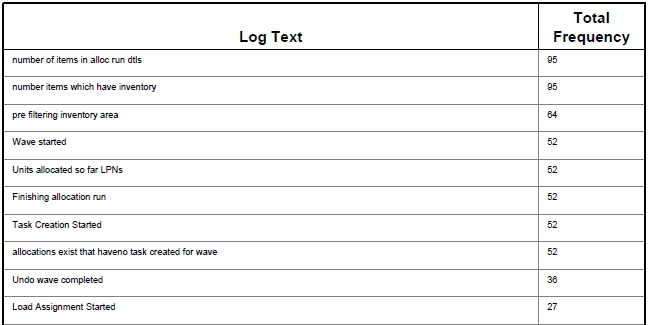
Wave Data
NOTE: You also have the option to click the button without selecting any wave details, in which case the first five pages of waves shown in the UI based on the search criteria, if any, will be selected for the analysis.
Steps to Enable
You don't need to do anything to enable this feature.