Find Rates Statistics - Bulk Plan and Historical Metrics
This feature extends the available performance related Rating statistics in Bulk Plans and for Historical Metrics - to include information related to the time required to find rates. The information reported includes the number of records returned, the total response time for fetching the rates, and the maximum and average time required. You will find this information useful for monitoring the health of your system and, in diagnosing performance issues related to rating..
Bulk Plan Rating Engine Performance Statistics
The following additional Rating Engine Performance Statistics are now provide for your Bulk Plans.
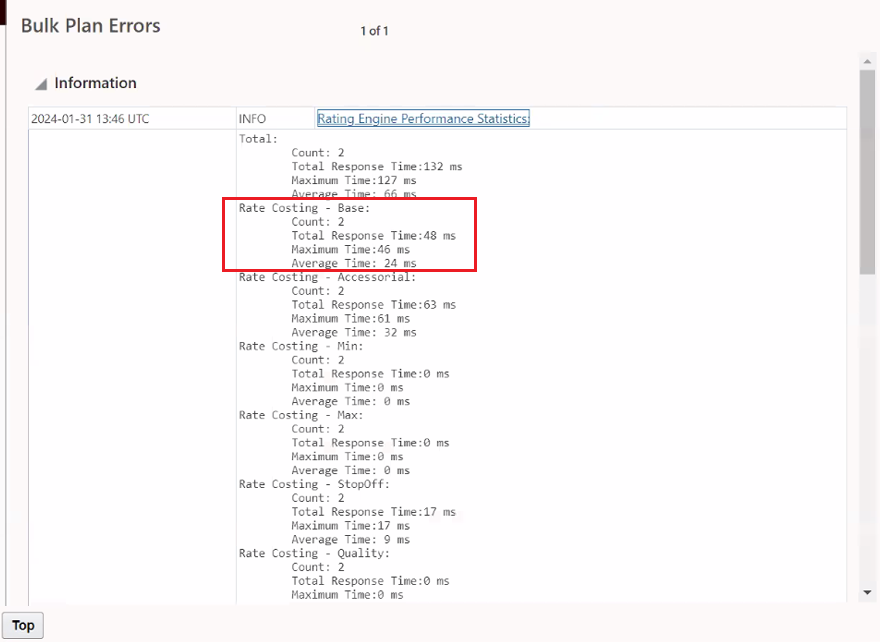
Bulk Plan Find Rate Statistics
Historical Metrics
The Historical Metrics UI can be found by navigating to Configuration and Administration > Metric Alert Management > Historical Metrics. Note: You must be a DBA to access this page.
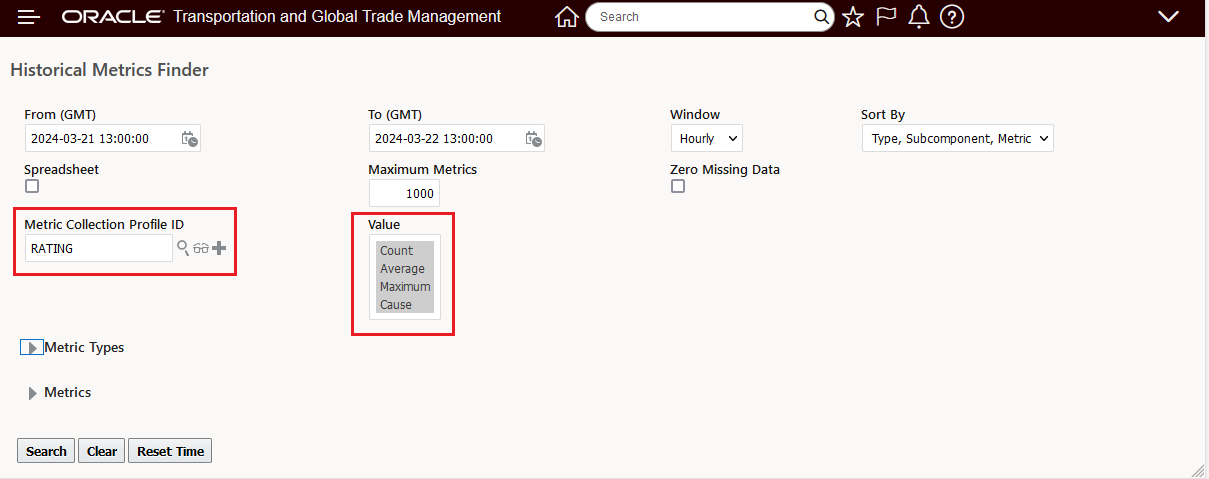
Historical Metrics Rating Metrics Setup
Below for Rating Related Historical metrics view where the statistics have been gathered on an hourly basis..
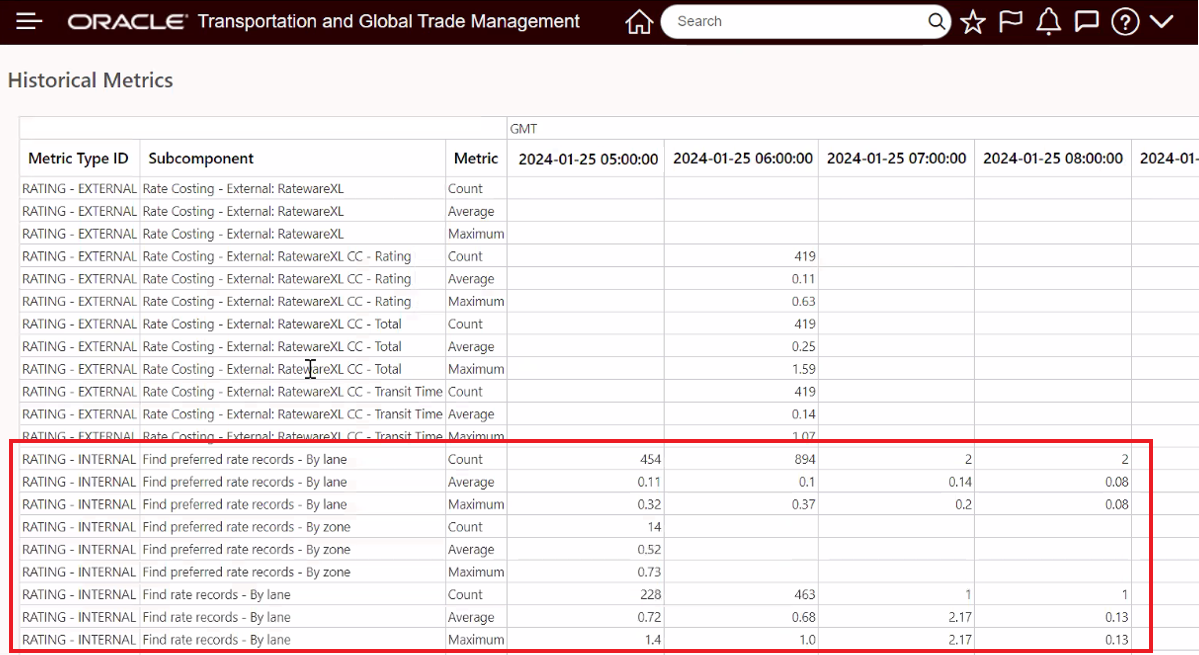
Historical Metrics Find Rate Statistics
The feature provides you more insight into the typical performance associated with fetching rate records. This information can be used to identify deviations from typical performance and alert you to potential issues.
Steps to Enable
You need to set the below properties as true to view the Rating Engine Performance Statistics:
- glog.bulkplan.ratingStatistics.enabled
- glog.metric.enabled