Data Visualization (DV) subject area - Global Trade Operational Intelligence
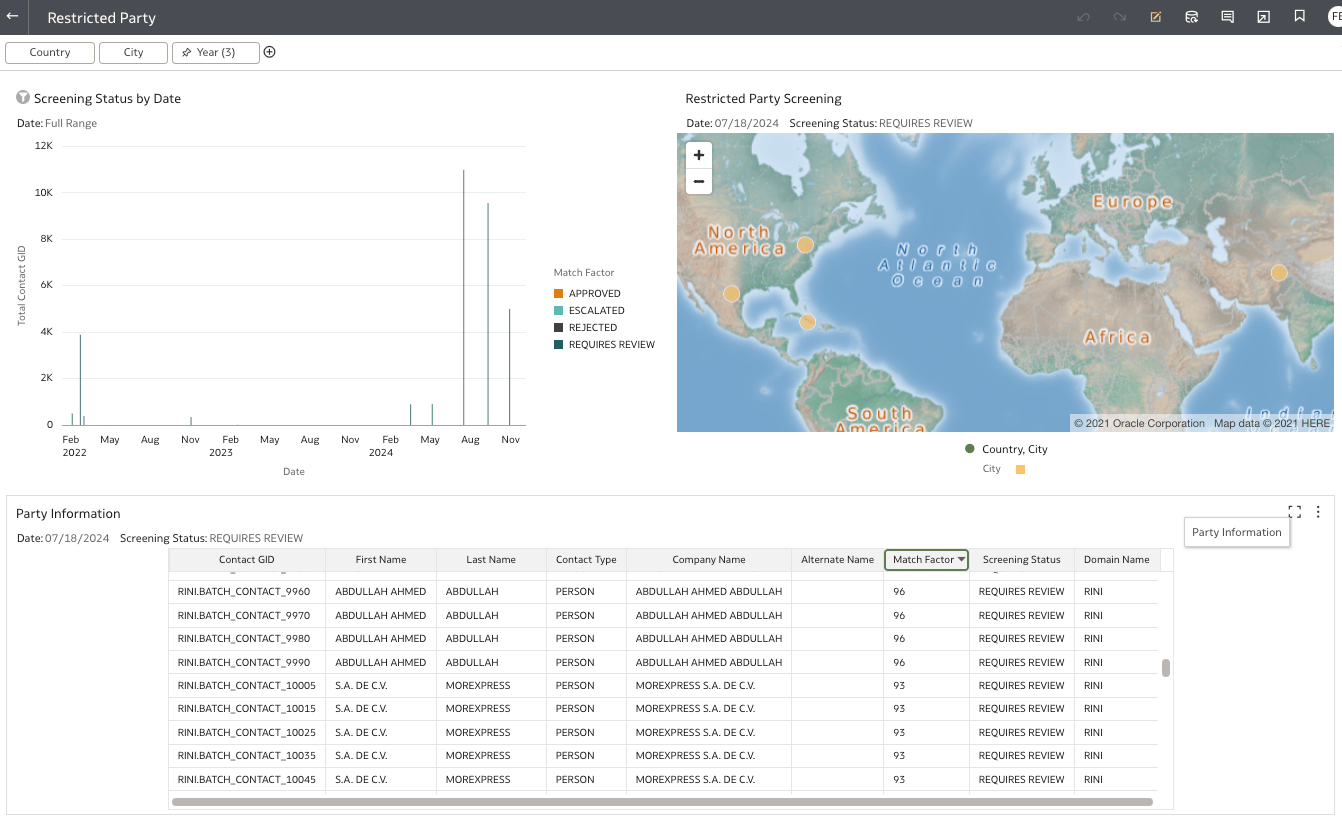
This feature provides you with a new out of the box Data Visualization (DV) Workbook within Global Trade Operational Intelligence which displays various metrics related to restricted party screening. You can navigate to Global Trade Intelligence > Data Visualization. Under Workbooks, select Restricted Party. Within this workbook, there are three sections:
- Screening Status by Date - In the top left, you can see the Screening Status by Date bar chart. By default, this bar shows all data available in the operational database. When you click on a bar, the Restricted Party Screening map and the Party Information table filter based on the date selected. In this example, a date of 07/18/2024 is selected.
- Restricted Party Screening - In the top right, you can see the Restricted Party Screening map displaying the locations associated with the restricted parties. By default, this map shows all data available in the operational database but can be filtered based on a date selected in the Screening Status by Date bar chart.
- Party Information table - In the bottom, you can see a table display a list of parties including name, match factor, and screening status. By default, this table shows all data available in the operational database but can be filtered based on a date selected in the Screening Status by Date bar chart.
In addition to filtering based on a date selected in the Screening Status by Date bar chart, you can also filter based on Country, City, and Year. These filters are available above the Screening Status by Date bar chart.
Data Visualization - Restricted Party Screening
This feature provides you with a new Data Visualization (DV) Workbook within Global Trade Operational Intelligence. The Global Trade Operational Intelligence subject area is unique since it enables DV reporting and analysis access to your operational data allowing for better oversight of restricted party screening operations and ability to monitor process improvement trends.
Steps to Enable
For a user who needs access to Global Trade Operational Intelligence, navigate to User Manager and add a Business Intelligence Application = GTOI.
Tips And Considerations
As with any reporting that operates against your operational data, there is a possibility for the reporting (queries used in the reporting) to impact performance. To avoid surprises, performance testing should be a part of your testing plans for any reports developed using the Global Trade Operational Intelligence subject area.
Key Resources
- For more information, please refer to the Global Trade Intelligence > Global Trade Operational Intelligence topic in help.