LNM - Shipment Emissions Added to LNM Data Visualization
This feature enhances the LNM Data Visualization reporting to include the per Modeling Shipment Planned C02 and Planned CO2e emissions. The inclusion of the planned emissions values will be useful in all your LNM scenarios that include calculated emissions.
In the example below, the LNM - Scenario Graph shows the inclusion of the Per Shipment Planned C02 and Planned CO2e
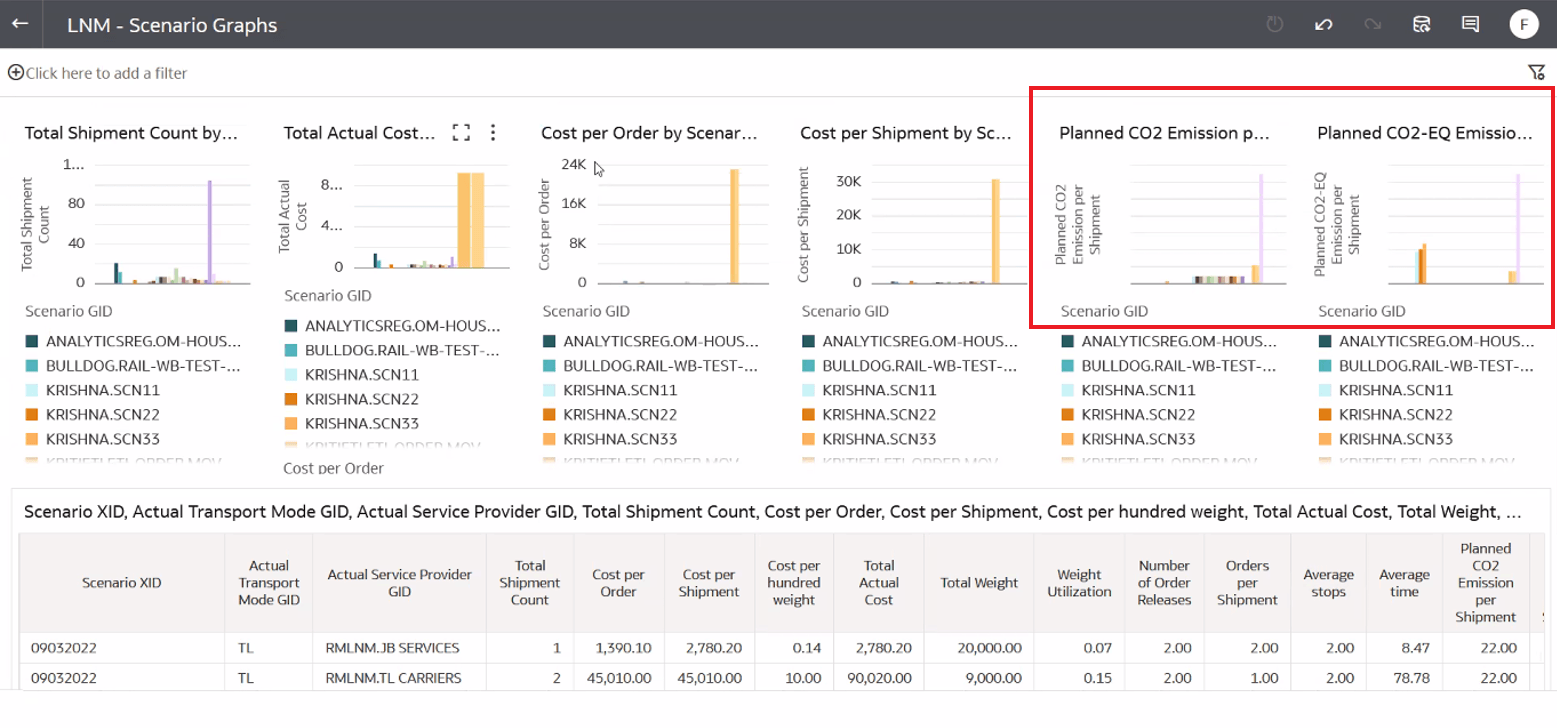
LNM Scenario Graph with Per Shipment Planned C02 and Planned C02e Included
The table view of the graphed info is below.
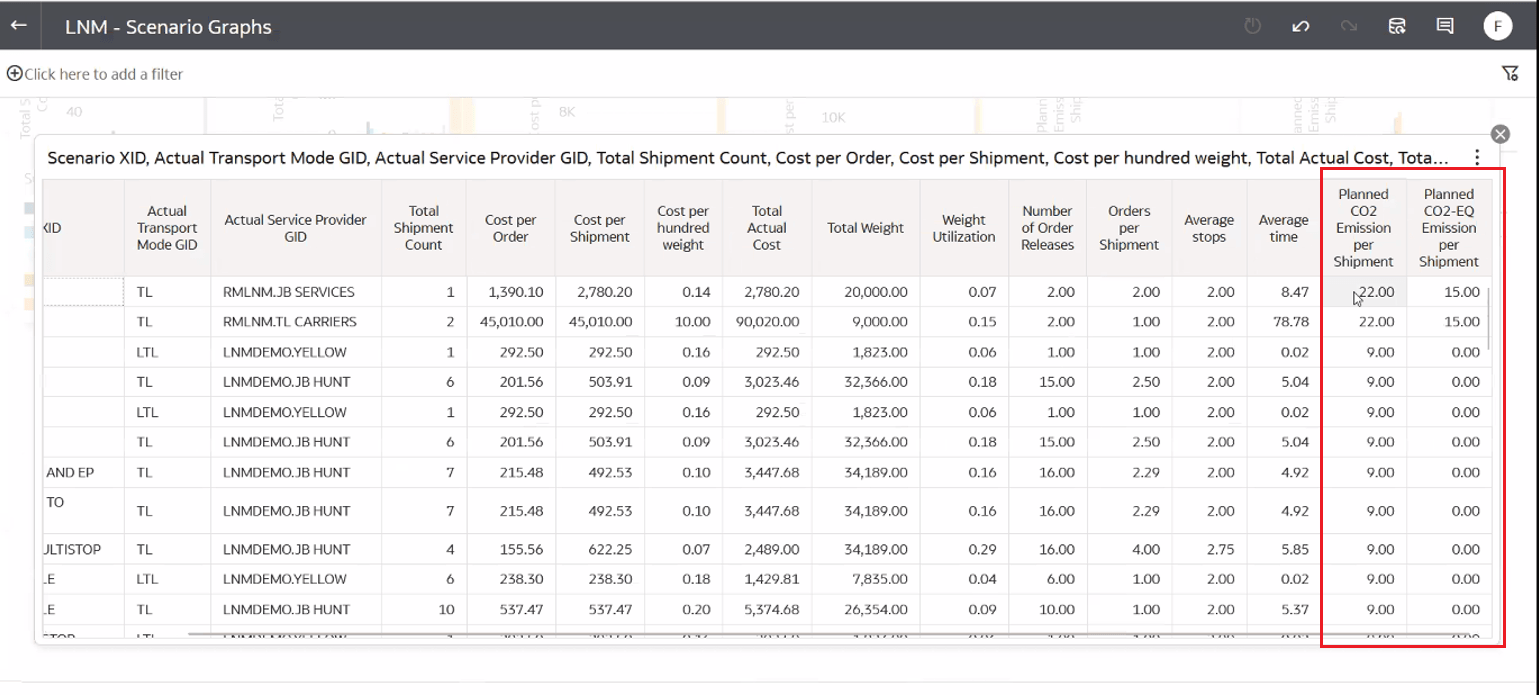
Table View of Scenario Graph Data with Per Shipment Planned C02 and Planned C02e
This feature extends the LNM Data Visualization feature to include both Planned C02 and Planned C02e for analysis within our Modeling Scenarios.
Steps to Enable and Configure
You don't need to do anything to enable this feature.