Visualize Warehouse Employee Break Metrics with Redwood WFM Dashboard
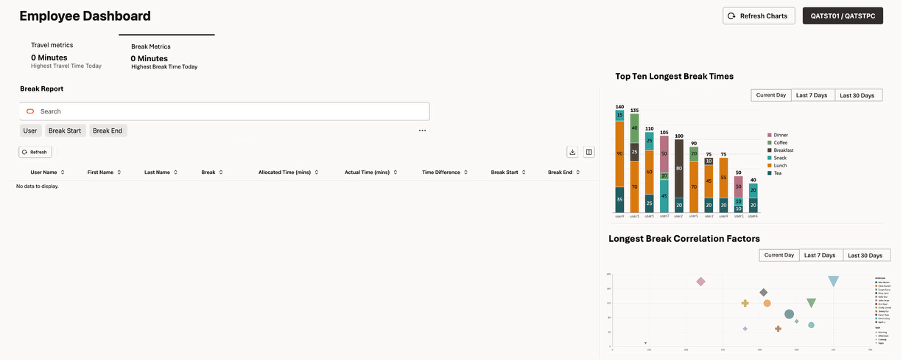
In addition to Travel Metrics, a new tab has been introduced on the Redwood WFM Dashboard to showcase employee break metrics through visualized datasets. For warehouse supervisors, this feature is instrumental in making informed decisions related to organizational policies and in improving operational efficiency.
This tab includes a data grid report that allows you to filter and retrieve break records for any employee. A stacked bar chart highlights the top 10 longest employee break times, enabling supervisors to gain valuable insights—such as identifying specific breaks that contribute to overall high break durations. A bubble chart provides additional correlation factors, such as long work hours or certain shifts that may influence extended break times.
Employee Dashboard
When you hover over the data points in the stacked bar or bubble chart, additional details about each break are displayed. You can also drill down into any data point to refresh the break report with detailed records for the selected employee.
Finally, toggle buttons are available on the charts to compare trends across the current day, past week, or past month.
Steps to enable and configure
You don't need to do anything to enable this feature.