Display Stockout Metric in Buyer Planning
For any enterprise, it’s critical to understand when you may run out of material and be unable to fulfill your demand. Having advance visibility to such an exception is critical to your business operations.
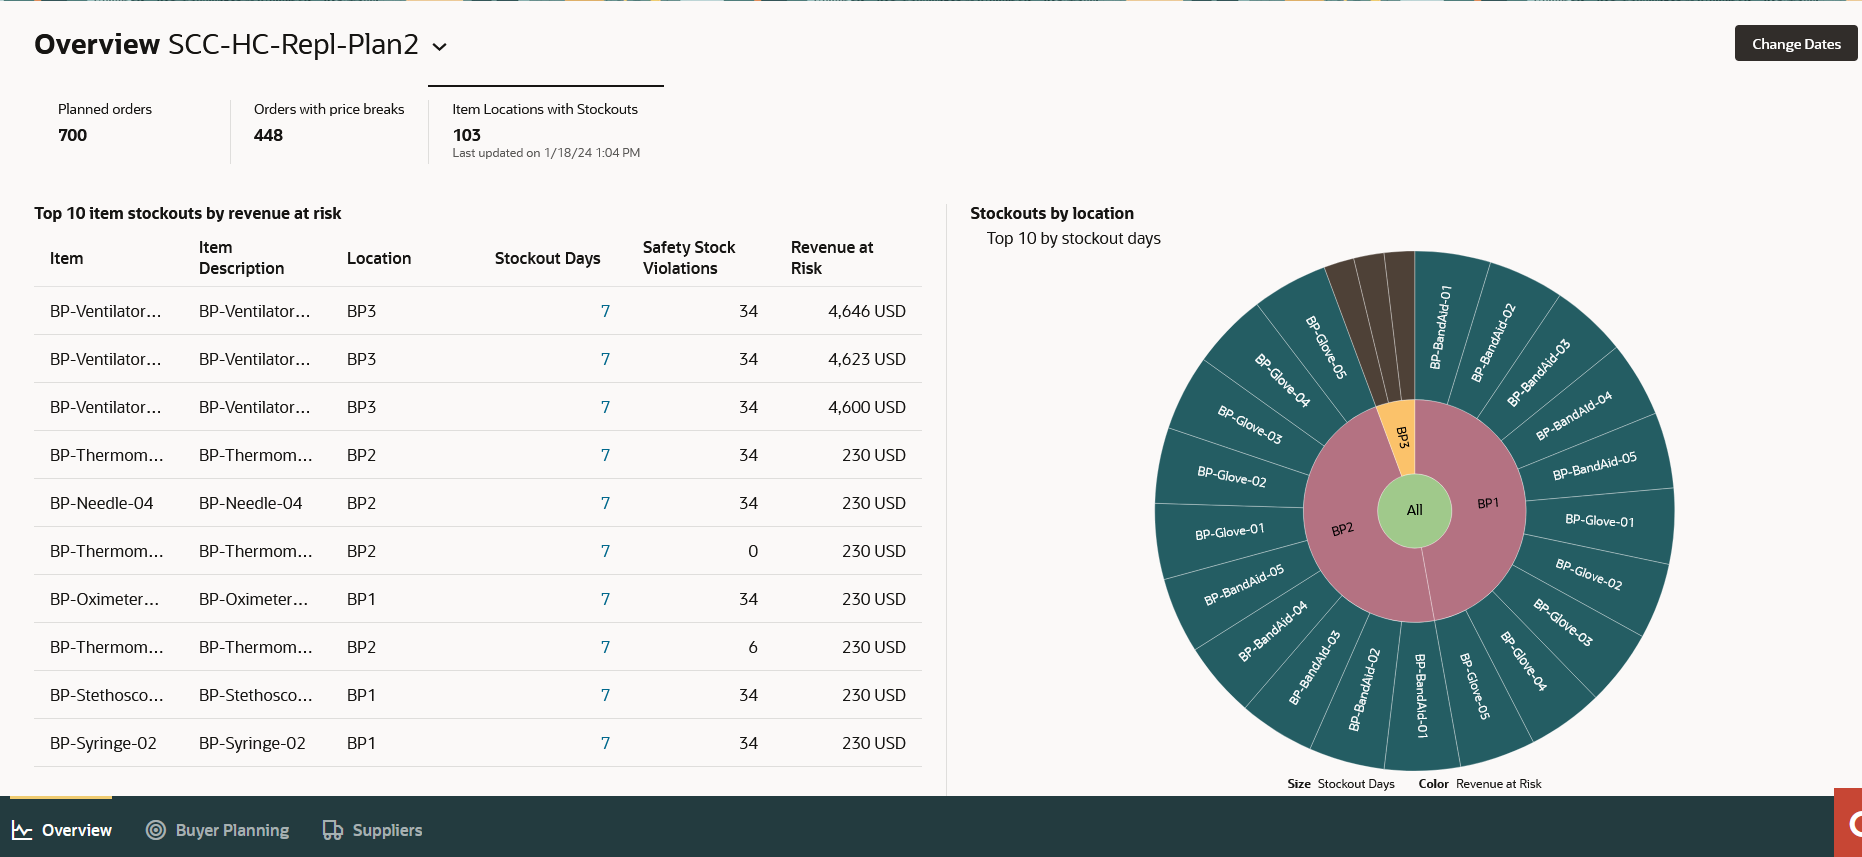
With this update, a new Item Locations with Stockout metric is part of the Buyer Planning dashboard. This metric displays:
- Top 10 item stockouts by revenue at risk: A table that displays the top 10 item locations by stockout days. It also displays the revenue that is at risk due to the stockout.
- Stockouts by location: A sunburst chart that displays the top 10 items for each location by stockout days. When you select a specific location the sunburst chart is refreshed to display the top 25 items by stockout days, and the table mentioned in the prior bullet is refreshed to show stockouts for that location only.
In addition, you can access the Inventory Analysis page for the specific item location by clicking on the stockout days to get additional details, such as projected available balance, average daily demand, and updated days of cover. Use this information to analyze your overall plan results and take proactive steps to prevent a stockout.
Details regarding the metric
- The new Item Locations with Stockouts metric:
- Displays a list of the top 10 items locations by the highest estimated revenue at risk.
- Each item location shows the number of stockout days for the given date period, the number of days with a safety stock violation, and the revenue at risk.
- You can click on the stockout days number to view the detailed Inventory Analysis page for the given item, which will show you the dates of the stockouts and safety stock violations, along with additional information.
- The Stockouts by location chart:
- Displays the top 10 items stockouts in each location by the number of stockout days.
- The size of the segment varies by the number of stockouts, and the color of each segment varies by the revenue at risk.
Details for viewing the metric
To refine the stockouts data, click the Change Dates action button and modify the date range.
Item Locations with Stockouts Metric
Hover over the location in the chart to display the total number of stockout days and the revenue at risk for the items at that location. Hover over an item to display that item’s stockout days and revenue at risk.
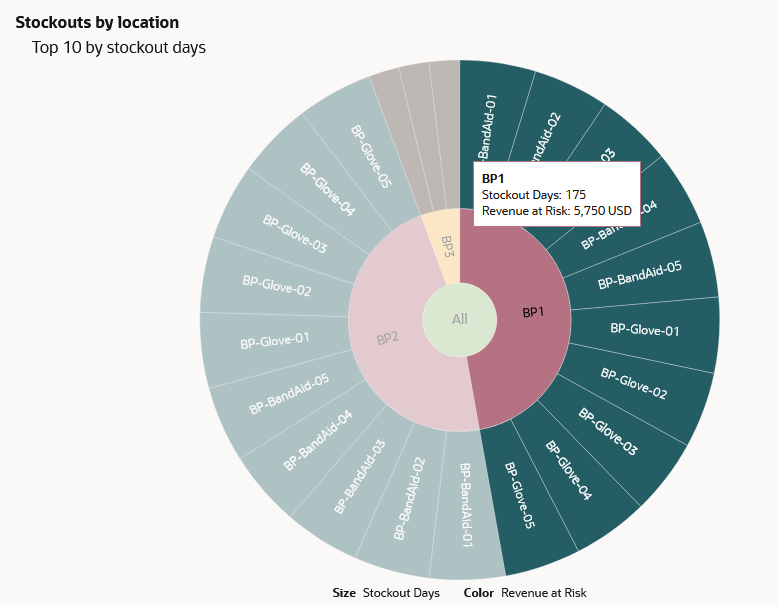
Details Displayed Upon Hovering
You can get details for a specific location.
- Click on a location in the chart to draw the chart again to show the details for just that location with the top 25 item stockouts for that location displayed.
- At the same time, the Top 10 Item Stockouts by Revenue at Risk table on the left will be refreshed to show entries for only that location.
To reset the chart to the default view of all locations, click the All link.
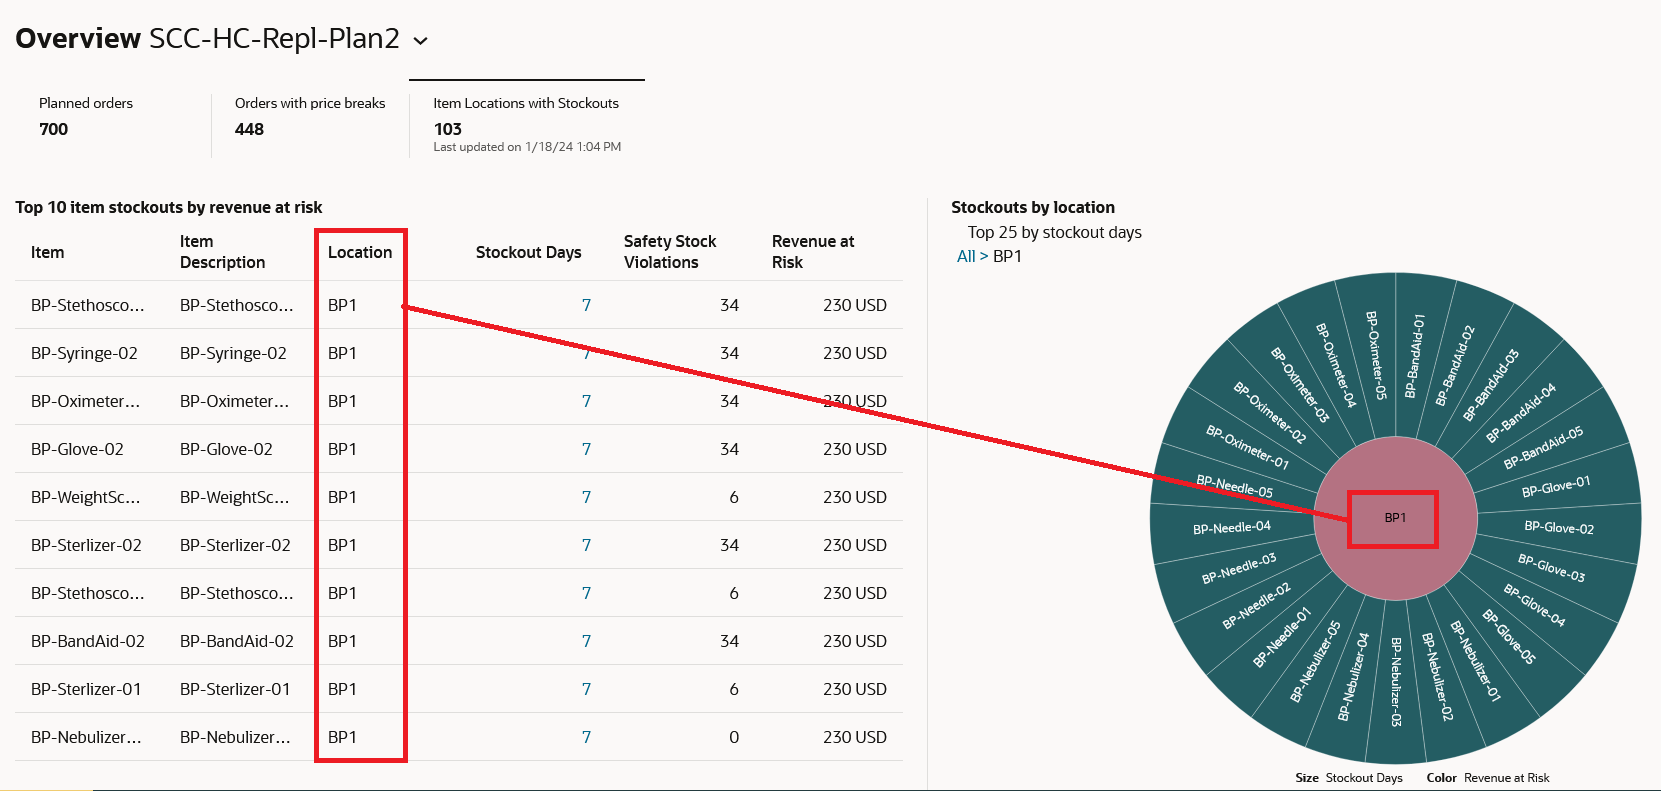
The Stockout Metrics Refreshed to Show Data for One Location
Steps to Enable
Use the Opt In UI to enable this feature. For instructions, refer to the Optional Uptake of New Features section of this document.
Offering: Supply Chain Planning
Tips And Considerations
If you want to use the Display Stockout Metric in Buyer Planning feature, then you must opt in to its parent feature: Replenishment Planning. If you’ve already opted in to this parent feature, then you don’t have to opt in again.
When there are no item stockouts, the metric card won’t be displayed.
Key Resources
- Watch the Display Stockout Metric in Buyer Planning demo.
Access Requirements
Users who are assigned a configured job role that contains these privileges can access this feature:
- Monitor Buyer Planning Work Area (MSC_MONITOR_BUYER_PLANNING_WORK_AREA_PRIV)
These privileges were available prior to this update.