Redwood: Use a Default Page Layout to Review Replenishment Plans
You can use the Replenishment Plan Analysis page, a seeded Redwood page within the Replenishment Plan Overview page group, to review replenishment plans. Using this page, you can perform the daily activities of a planner.
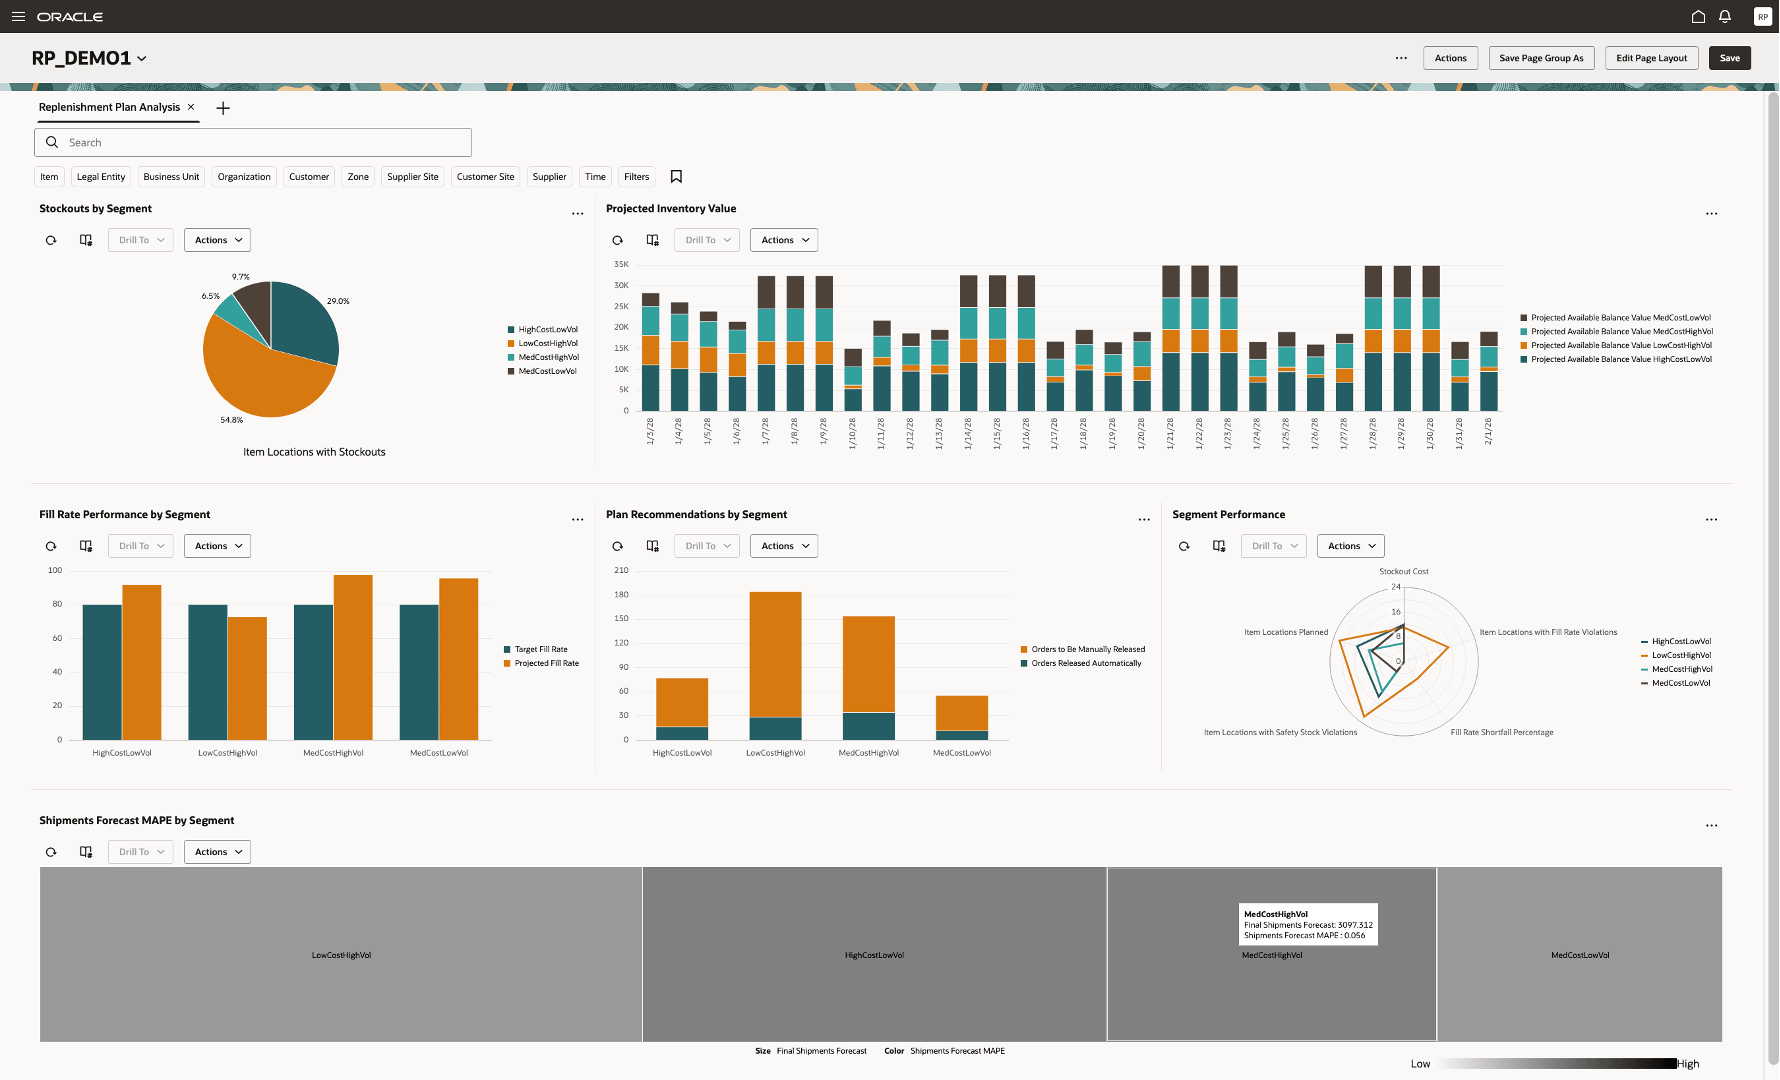
The default set of tables and graphs on the page is as follows:
- Stockouts by Segment: A pie chart displaying the percentages of item-location combinations with stockouts by segment.
- Fill Rate Performance by Segment: A bar chart displaying the target and projected fill rates by segment.
- Segment Performance: A radar chart that displays key measures to help you immediately determine segment performance.
- Projected Inventory Value: A stacked vertical bar graph that displays a time-phased view of the projected available balances by segment.
- Plan Recommendations by Segment: A stacked vertical bar graph that displays the orders automatically released and orders to be manually released by segment.
- Shipment Forecast MAPE by Segment: A tree map that displays the shipments forecast and mean absolute percentage error (MAPE) of the shipments forecast by segment and organization.
You can modify these default tables and graphs to address your business use case.
The Replenishment Plan Analysis page is displayed by default when you open a replenishment plan in the Redwood Supply Chain Planning work area.
Replenishment Plan Analysis Page
Here's the demo of these capabilities:
Steps to Enable
Use the Opt In UI to enable this feature. For instructions, refer to the Optional Uptake of New Features section of this document.
Offering: Supply Chain Planning
The following site-level profile should be enabled:
-
- Redwood Replenishment Planning Pages Enabled (ORA_MSC_REPLENISHMENT_PLANNING_REDWOOD_ENABLED)
Tips And Considerations
If you want to use the Redwood: Use a Default Layout to Review Replenishment Plans feature, then you must opt in to its parent feature: Replenishment Planning. If you’ve already opted in to this parent feature, then you don’t have to opt in again.
The Replenishment Plan Analysis page is designed for plans that are enabled for policy, replenishment, and forecast calculations. For replenishment plans that are enabled for inventory rebalancing or policy comparison, you can duplicate the provided visualizations and reconfigure them to match your requirements.
- On the Actions menu, under Pages and visualizations, select Planning Visualizations to open the Visualization page, where you can duplicate and reconfigure these visualizations.
- On the Actions menu, under Pages and visualizations, select Planning Pages to open the Pages page. On the Pages tab, you can create a page for these duplicated visualizations.
- On the Actions menu, under Pages and visualizations, select Planning Pages page to open the Pages page. On the Page Groups tab, you can create a page group and indicate which page group is opened by default for replenishment plans.
For the vertical bar graph named Fill Rate Performance by Segment, you need to configure a pivot table with the Target Fill Rate measure and specify target fill rates for each of your segments. You can then use this graph to compare the target fill rates with the projected fill rates computed by your replenishment plan.
For the Orders Released Automatically measure to be computed for the vertical bar graph named Plan Recommendations by Segment, you must select the Release planned orders automatically checkbox on the General subtab on the Supply tab on the Plan Options page for your replenishment plan. You’ll need to open the Plan Options page for your plan from outside the Redwood work area.
For multiechelon plans, the Constrained Projected Available Balance measure is used for computing these measures:
- Inventory Turns
- Item Locations with Safety Stock Violations
- Item Locations with Stockouts
- Projected Available Balance Value
- Projected Fill Rate
- Projected Inventory Cost
- Stockout Cost
For a single-echelon plan, Oracle Replenishment Planning continues to use the Projected Available Balance measure (unconstrained) to compute these measures.
Key Resources
- Watch the Redwood: Use a Default Page Layout to Review Replenishment Plans demo.
- Refer to the Cloud Applications Readiness content for the following 25B features for Oracle Fusion Cloud Supply Chain Planning:
- Analyze Replenishment Plans Using a Configurable Redwood Page
- Use Graphs to Analyze Plans Using a New User Experience
- Use Pivot Tables to Analyze Plans Using a New User Experience
Access Requirements
Users who are assigned a configured job role that contains these privileges can access this feature:
- Monitor Replenishment Planning Work Area (MSC_MONITOR_REPLENISHMENT_PLANNING_WORK_AREA_PRIV)
- Manage Segments (MSC_MANAGE_SEGMENTS_PRIV)
These privileges were available prior to this update.