Redwood: Use a Default Page Layout to Review Demand Plans
One of the key aspects of managing demand for your enterprise is to monitor the forecast accuracy. This update includes a default page that enables you to isolate the product categories with low forecast accuracy using a treemap and to visualize the forecast for items in selected product categories using a Gregorian calendar in a graph and a table. This page enables you to monitor and adjust the forecasts for items that you’ve selected. This page is provided as a sample that can be adjusted to circumstances relevant for your enterprise such as using a different calendar.
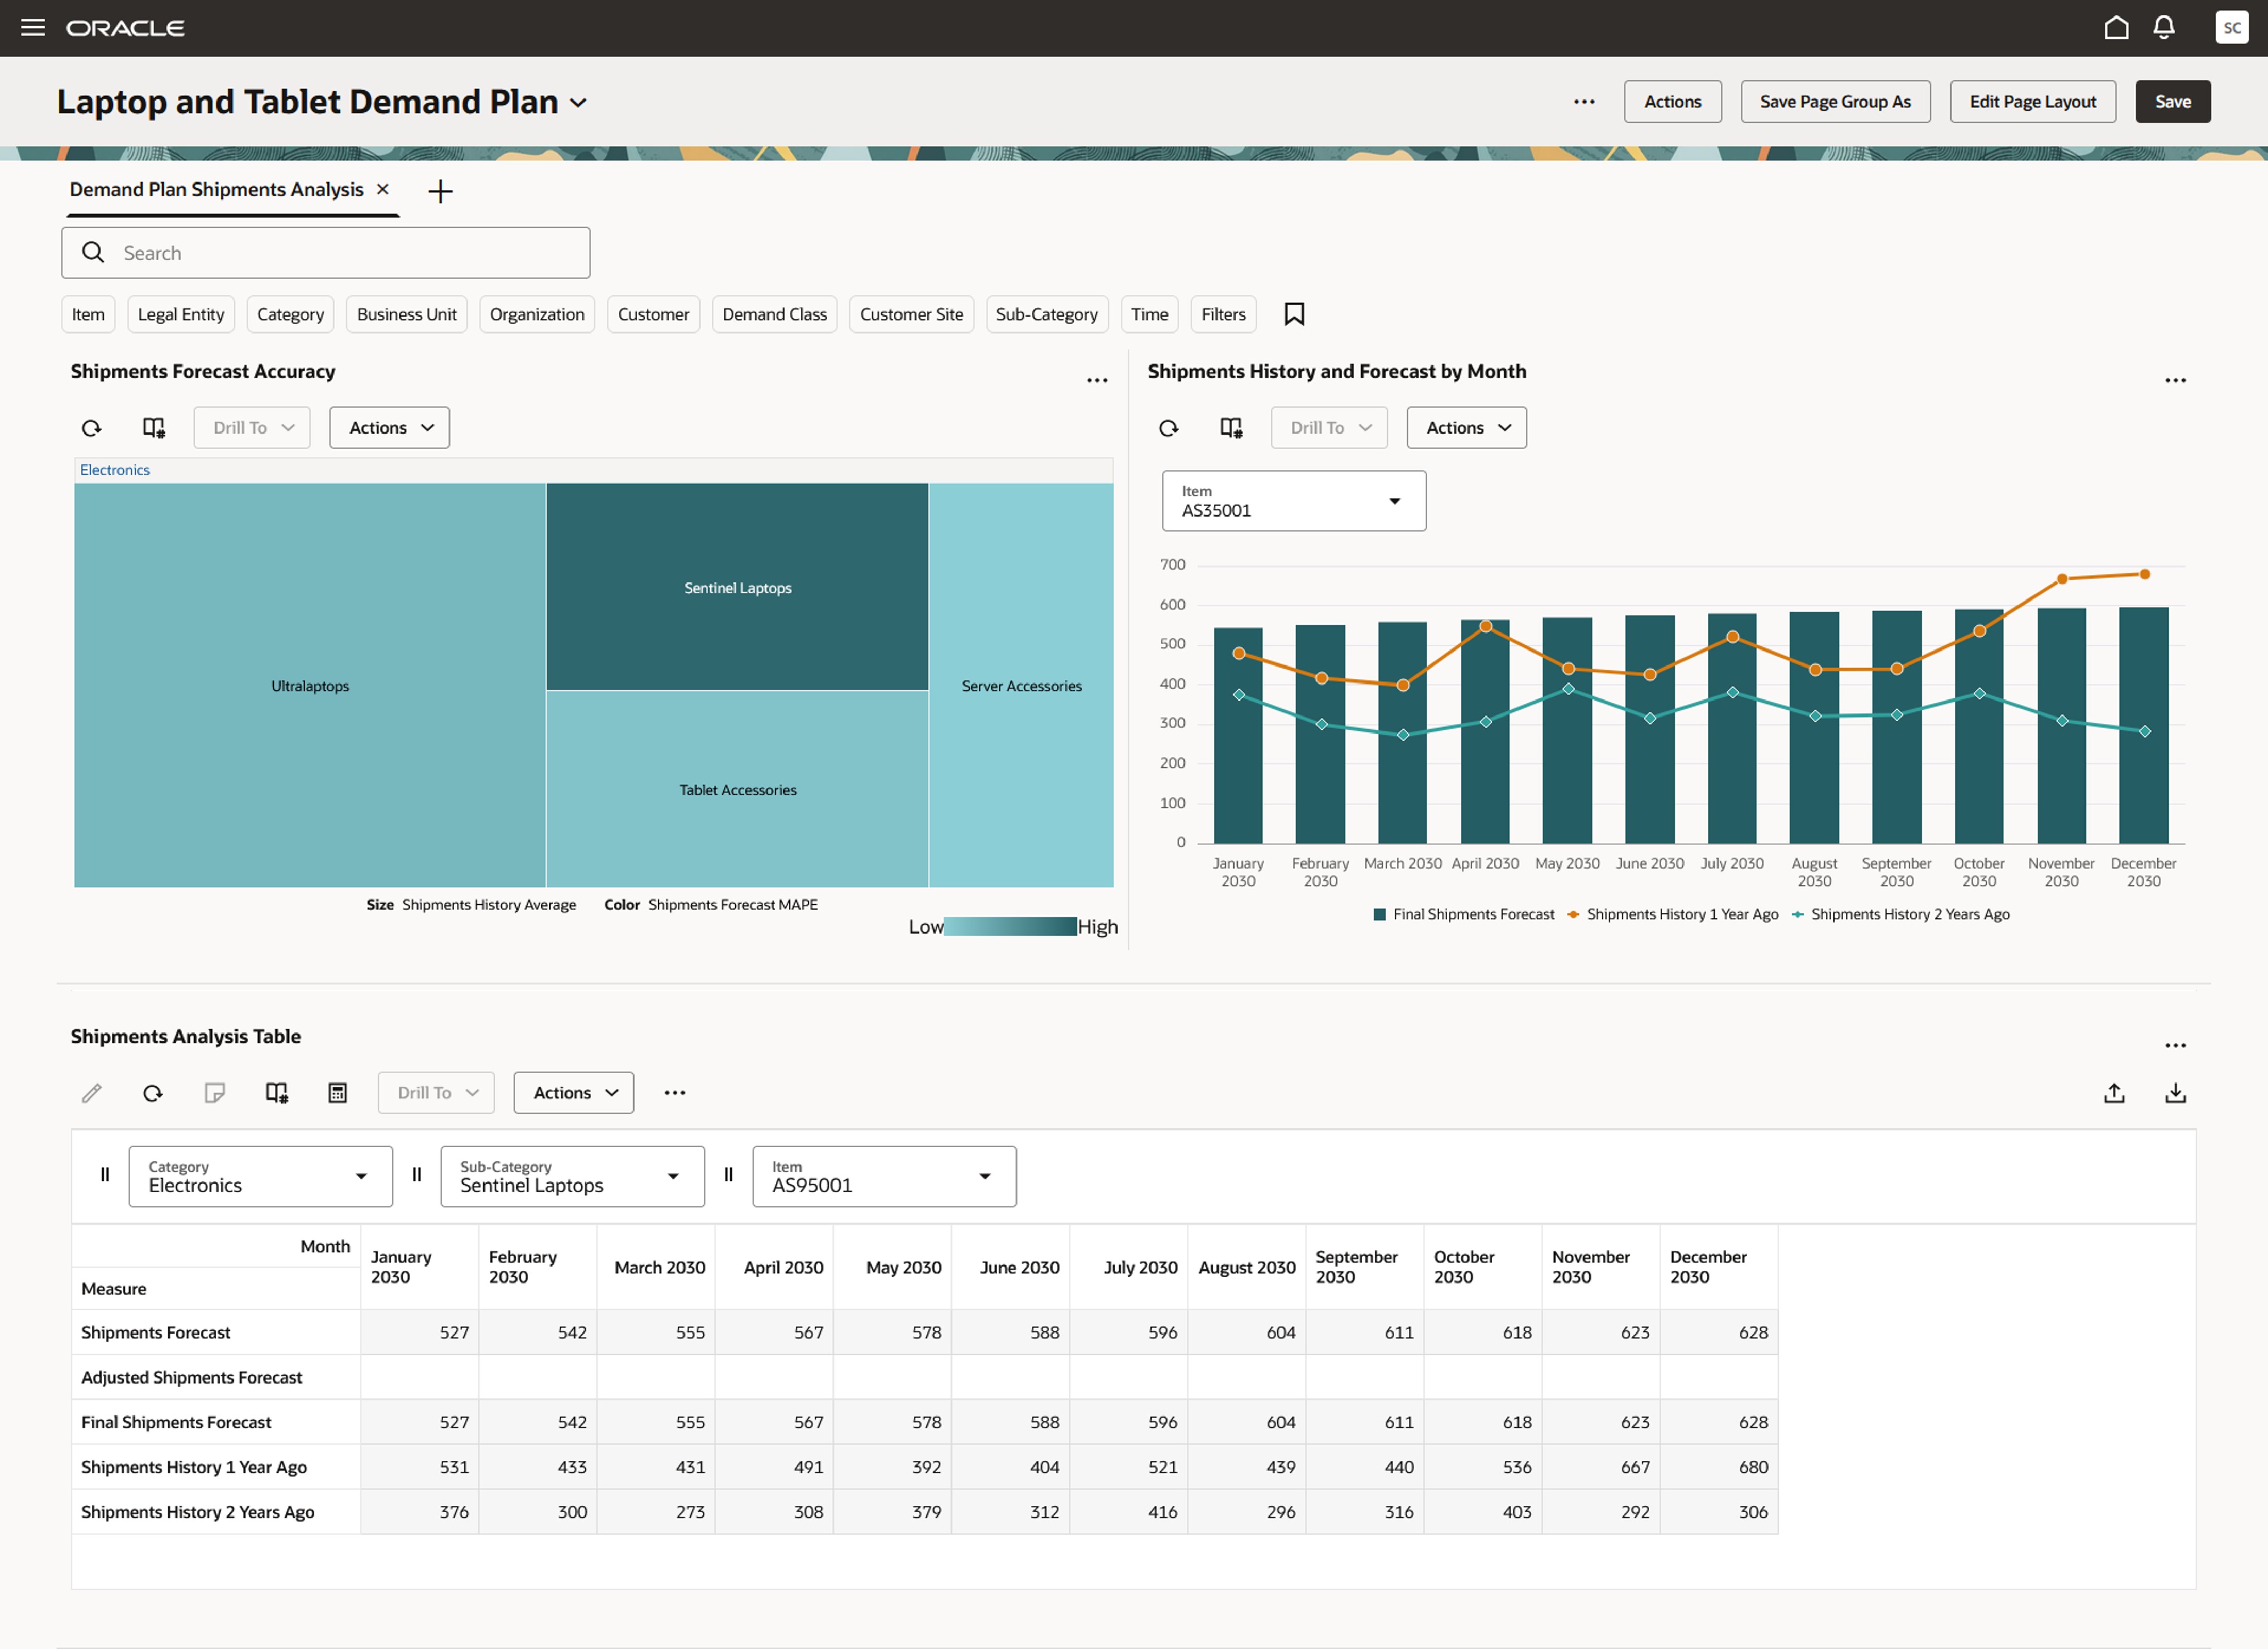
The Demand Plan Shipments Analysis page is displayed by default when you open a demand plan in the Redwood Supply Chain Planning work area.
Demand Plan Shipments Analysis Page
The Demand Plan Shipments Analysis page is contained in the Demand Plan Overview page group and includes three visualizations:
- Shipments Forecast Accuracy: This visualization is a treemap that shows the forecast accuracy by category.
- The size of the box for a category represents the shipments history average. The higher the historical demand, the larger the box will be.
- The color of the box represents the mean absolute percentage error (MAPE) for the shipments forecast, which measures the accuracy of the forecast in comparison to the actual demand. The darker the box, the higher the MAPE will be. The higher the MAPE, the lower the forecast accuracy will be.
Click a box to drill to the items within the category.
- Shipments History and Forecast by Month: This visualization is a combination graph that compares the forecast to the previous two years of history by month for the selected item.
- The bars represent the final shipments forecast.
- The lines represent the shipments history one year ago and shipments history two years ago.
The graph displays data for a single item. Use the filters to select the item.
- Shipments Analysis Table: This visualization is a pivot table that displays the same information as in the Shipments History and Forecast by Month graph but provides the ability to enter forecast overrides through the Adjusted Shipments Forecast measure.
The table displays data for a single item. Use the filters to select the item.
The Shipments Forecast Accuracy treemap is linked to the Shipments History and Forecast by Month graph and the Shipments Analysis Table. When you click a box in the treemap, the other two visualizations are automatically refreshed and filtered based on this selection.
Steps to Enable
You don't need to do anything to enable this feature.
Tips And Considerations
The Demand Plan Shipments Analysis page is designed for plans that use shipments as their demand stream and display data in Gregorian months. For demand plans that use a different demand stream, such as bookings, or a different calendar, such as a manufacturing or fiscal calendar, you can duplicate the provided visualizations and reconfigure them to match your requirements.
- On the Actions menu, under Pages and visualizations, select Planning visualizations to open the Visualization page, where you can duplicate and reconfigure these visualizations.
- On the Actions menu, under Pages and visualizations, select Planning Pages to open the Pages page. On the Pages tab, you can create a page for these duplicated visualizations.
- On the Actions menu, under Pages and visualizations, select Planning Pages to open the Pages page. On the Page Groups tab, you can create a page group and indicate which page group is opened by default for demand plans.
Key Resources
- Refer to the Cloud Applications Readiness content for the following 25B features for Oracle Fusion Cloud Supply Chain Planning:
- Redwood: Analyze Demand Plans Using a Configurable Redwood Page
- Redwood: Use Pivot Tables to Analyze Plans Using a New User Experience
- Redwood: Use Graphs to Analyze Plans Using a New User Experience
- Redwood: Manage Pages and Page Groups Using a New User Experience
- Redwood: Manage Visualizations Using a New User Experience
- Redwood: Configure Pivot Tables and Graphs Using a New User Experience
Access Requirements
Users who are assigned a configured job role that contains this privilege can access this feature:
- Monitor Demand Management Work Area (MSC_MONITOR_DEMAND_MANAGEMENT_WORK_AREA_PRIV)
This privilege was available prior to this update.