Redwood: Simulate Demand Using a New User Experience
As a demand planner, you may need to simulate some changes to plan data and understand the effect they have on the demand forecast. The Redwood user experience enables you to regenerate the demand forecast for a specific subset of the plan where you may have changed some data such as a price. You can specify the forecast profile and target measures for the result of the simulation.
You can open the Simulate demand drawer from the Actions menu for a pivot table.
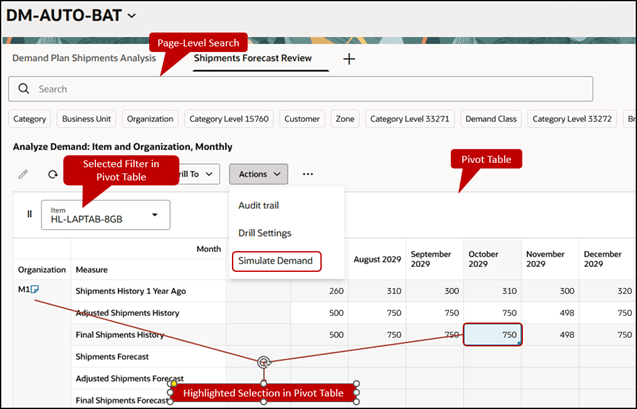
Actions Menu for Pivot Table
You can simulate demand in these modes:
- Generate forecast and compare: This default mode lets you select output measures different from those associated with the selected forecasting profile.
In this mode, the forecast, forecasting methods, and forecasting levels are stored by default in the Simulation 1, Simulation Methods 1, and Simulation Level 1 measures respectively if they’re included in the plan’s measure catalog. This default behavior occurs only if the forecasting profile’s output measure is defined with the Item, Organization, Customer Site, Demand Class, Sales Rep, and Day stored levels.
- Generate forecast and overwrite: This mode lets you save the simulation results in the output measures for the selected forecasting profile. The fields for output measures will be disabled.
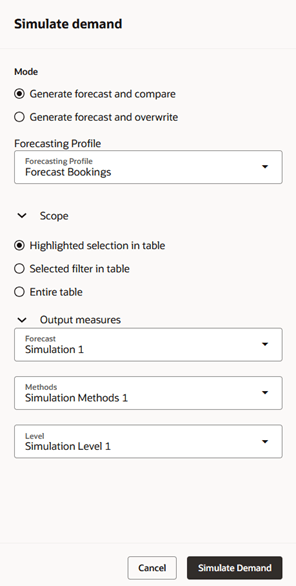
Drawer for Simulating Demand
The scope options define the subset of data (for example, item, organization, customer, and segment group) excluding Time dimension members for which you want to regenerate the demand forecast:
- Highlighted selection in table: This default option specifies the level member combination corresponding to the cell highlighted in the pivot table, including the level member selections in the pivot table filters and selections on the Members subtab in the properties drawer for the pivot table.
You can select multiple cells provided they belong to the same level member combination (for example, Item HL-LAPTAB-8GB in Organization M1). If you select cells belonging to different level member combinations (for example, Item HL-LAPTAB-8GB in Organization M1 and Item HL-LAPTAB-8GB in Organization M2), the scope is set to the combination for the cell that you selected last.
- Selected filter in table: This option specifies the level member selections in the pivot table filters and selections on the Members subtab in the properties drawer for the pivot table.
- Entire table: This option specifies the selections on the Members subtab in the properties drawer for the pivot table.
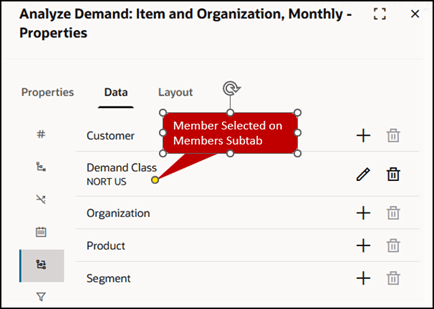
Members Selected on Members Subtab in Properties Drawer for Pivot Table
Clicking the Simulate Demand button initiates a scheduled process for the simulation, and you’ll receive a submission message at the bottom of the page with the process ID.
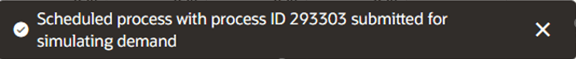
Submission Message for Simulating Demand
After the scheduled process completes successfully, you’ll receive a completion message at the bottom of the page with the process ID.

Completion Message for Simulating Demand
You’ll be notified through a message at the top of the page if the scheduled process ends with a warning or error.
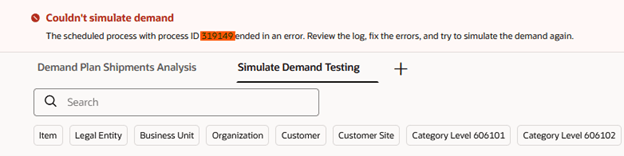
Warning or Error Message for Simulating Demand
Steps to Enable
You don't need to do anything to enable this feature.
Tips And Considerations
- The Redwood version of demand simulation doesn’t support the following:
- Decomposing the demand forecast by decomposition groups and forecasting methods.
- Duplicating a forecasting profile, modifying its definition, and then using the duplicated forecasting profile for demand simulation.
- Modifying the forecasting methods, decomposition groups and forecasting parameters before the demand simulation.
- Adding the output measures to the pivot table if they’re not already included.
- You can select forecasting profiles of only the Bayesian machine learning type that are included in the plan to simulate demand.
- Page-level search selections for your plan aren’t applied to the scope for demand simulation.
- If you submit the scheduled process with the Highlighted selection in table option selected in the Scope section but without selecting a cell, the demand is simulated for the entire table.
- Define the simulation scope using dimension levels that are part of the forecasting table for the forecasting profile. For example, if the forecasting table is defined with the Item and Organization dimension levels, you should set the simulation scope using these dimension levels. Otherwise, the simulated forecast may differ from the forecast generated after the plan run.
- The specified output measures for saving the simulation results must be manually added to the pivot table if they aren’t already included.
- The Simulate Demand menu option is available only in a pivot table that’s opened from a demand or demand and supply plan.
- A restriction was introduced in the 24A update to prevent planners from opening pivot tables while a plan is running. This restriction also covers the opening of pivot tables during demand simulation for both demand and demand and supply plans.
You can bypass this restriction by entering allowOpenPivotWhenPlanRunning=yes in the Parameter Overrides field in the Demand: Advanced Options dialog box that you can open from the Demand tab on the Plan Options page. This override will restore the behavior prior to 24A, allowing pivot tables to be opened during demand simulation as well as when the plan is running.
You'll need to open the dialog box for the plan from outside the Redwood work area.
Key Resources
- Related What’s New features for reference:
- Redwood: Analyze Demand Plans Using a Configurable Redwood Page
- Redwood: Use a Default Page Layout to Review Demand Plans
- Redwood: Use Pivot Tables to Analyze Plans Using a New User Experience
Access Requirements
Users who are assigned a configured job role that contains this privilege can access this feature:
- Simulate Demand Forecast (MSC_SIMULATE_DEMAND_FORECAST_PRIV)
This privilege was available prior to this update.