Redwood: Manage Visualizations Using a New User Experience
The Planning Visualizations action in the Redwood user experience lists all the tables and graphs that are enabled. You can filter the list by name, access, owner, plan type, and many other criteria. You can also add or remove any visualizations you own or create new ones by either duplicating an existing table or graph or defining their properties from scratch.
Use the Planning Visualizations option to view the details of pivot tables and graphs, duplicate visualizations and make changes to the planning visualizations. You can create, edit, and delete pivot tables and graphs. If required, you can also designate a change of ownership for the tables and graphs.
Accessing the Planning Visualizations Page Layout
To access the planning visualizations, go to the Actions menu and select Planning Visualizations.
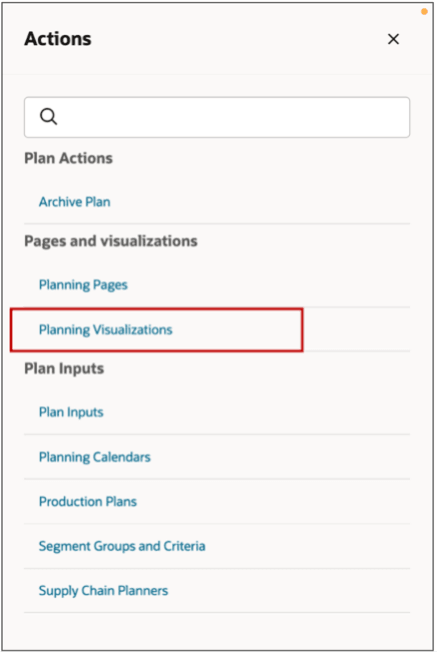
Actions Menu
The layout displays all the available visualizations of the plan through which this page is accessed. The name of the plan and its type are displayed. This plan's measure catalog, dimension catalog, and members are used to edit a visualization or create a new visualization.
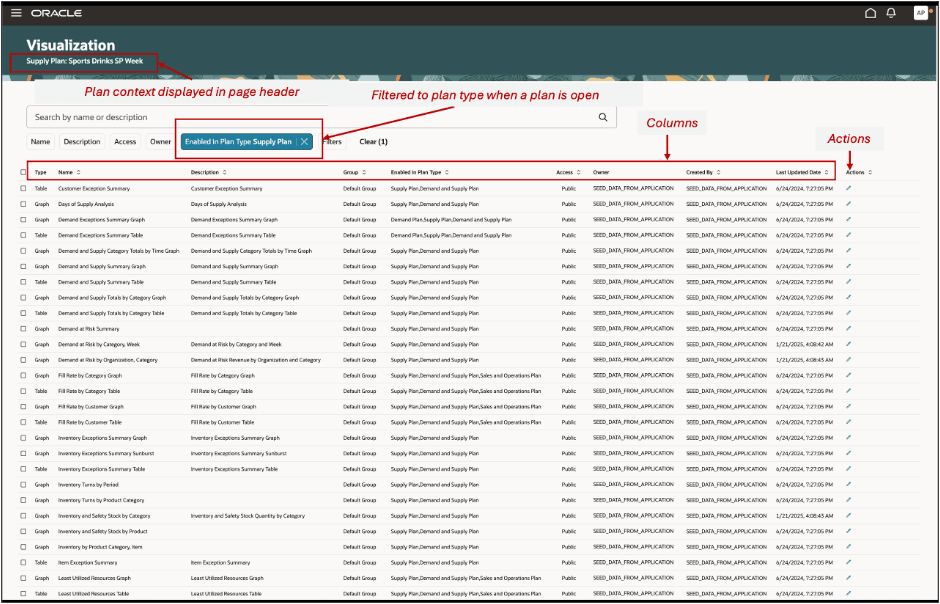
Planning Visualizations Page Layout
View and edit properties of a visualization

Edit Visualization Details
The visualizations include all the existing pivot tables and supported graphs from the current classic work areas.
Note: Tiles and Tile sets and some graph types aren’t supported. These are mentioned in the Tips and Considerations section.
The following columns are visible in this layout:
- Type of visualization
- Name of the visualization
- Description
- Group
- Enabled in Plan Type: supply chain plan type the visualization is enabled in. A visualization can be enabled in multiple plan types.
- Owner: present owner of the visualization
- Created by: creator of the visualization
- Last Updated Date
- Actions: This opens the selected visualization’s properties drawer where you can view and edit the visualization’s properties, data, and layout.
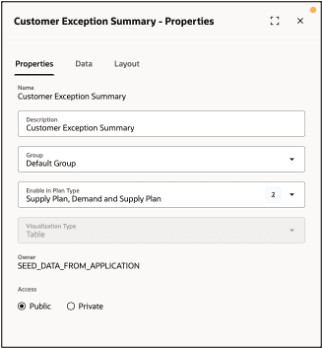
Visualization Properties
Duplicate a Visualization
You can duplicate a visualization by selecting a visualization and clicking the Duplicate button.
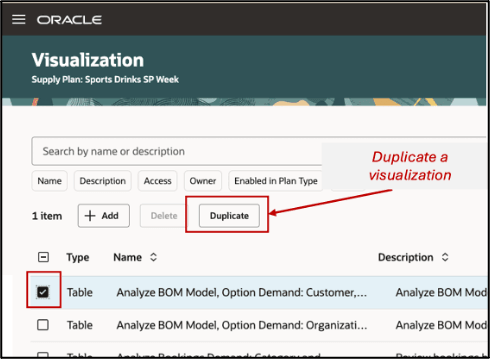
Duplicate a Visualization
When you are creating a duplicate, you can make changes to the following properties:
- Name
- Description
- Enable in Plan Type
- Public or Private access
- Copy user-specific layout changes
- Links to and from any other visualization or page associated with this visualization
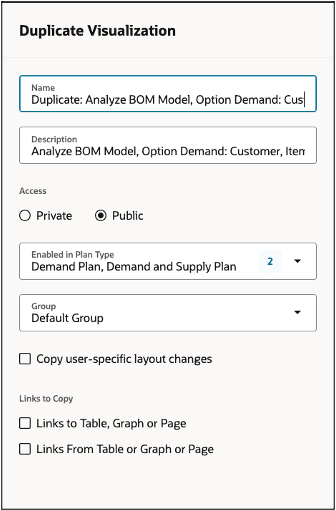
Change Properties of a Duplicate Visualization
Delete a Visualization
You can delete a visualization only if you are the owner of the visualization. Select one or multiple visualizations to delete.
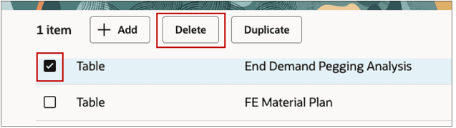
Select row for deletion
You can’t delete other users’ visualizations, but you can review their details, and duplicate them.
Change ownership of a visualization
Sometimes, visualization ownership needs to be changed, which is typically an administrator task. If the administrator has the required privilege, the Owner option on the visualization properties’ page can select a new owner from the list.
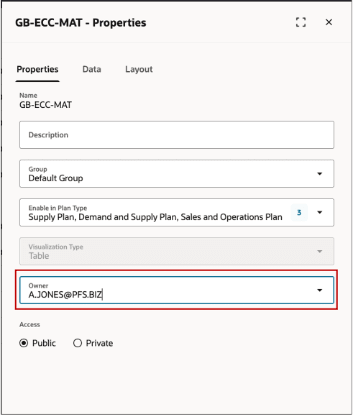
Change Ownership
The administrator must have the following privilege to manage planning objects.
Name: Manage Planning Objects
Code: MSC_MANAGE_PLANNING_OBJECTS
Use Filters to Search a Visualization
You can search for visualizations on this page using the following options:
- Enter keywords to search by Name and Description or use suggested filters.

Search Visualization
- Use the following advanced filters:
- Name
- Description
- Access
- Enabled in Plan Type
- Owner
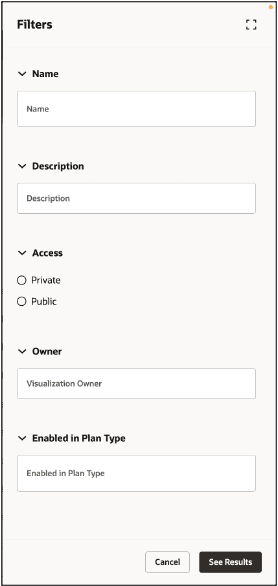
Filters
Configuring and Managing Links to other Visualizations and Pages
You can use the links to set up supplementary analytical relationship between visualizations such as tables and graphs or to another Redwood Page.
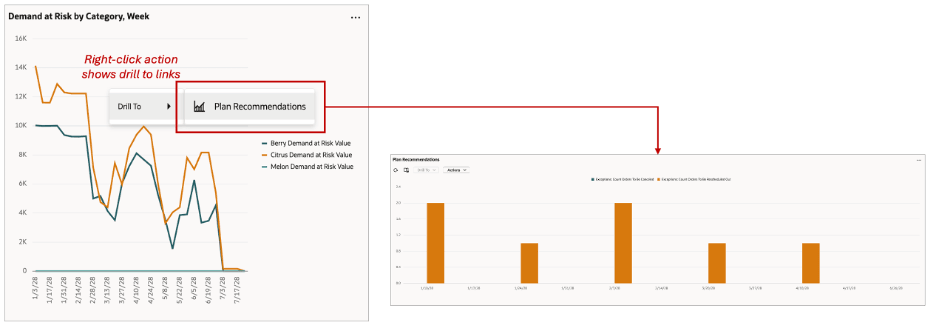
Managing Links
This could be drilling to:
- A visualization in the same page or page group
- A page in the same or another page group
- A visualization in another page group
Configuring the Links behavior
By choosing Manage Links from the Actions menu on the toolbar, you can link one table, graph, or page layout to another.
You can review the tables and graphs available to create a link to. You can search for the table or graph that needs to be linked to or from in the Manage Links drawer, accessible from the visualization’s properties menu.
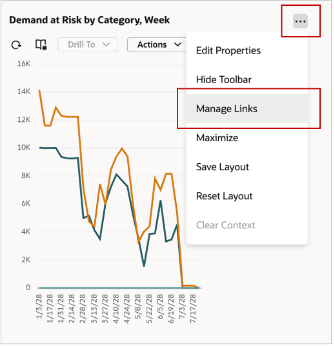
Manage Links menu action
This opens the visualization’ manage links drawer. To configure a link, add and select a link type: table, graph, or page.
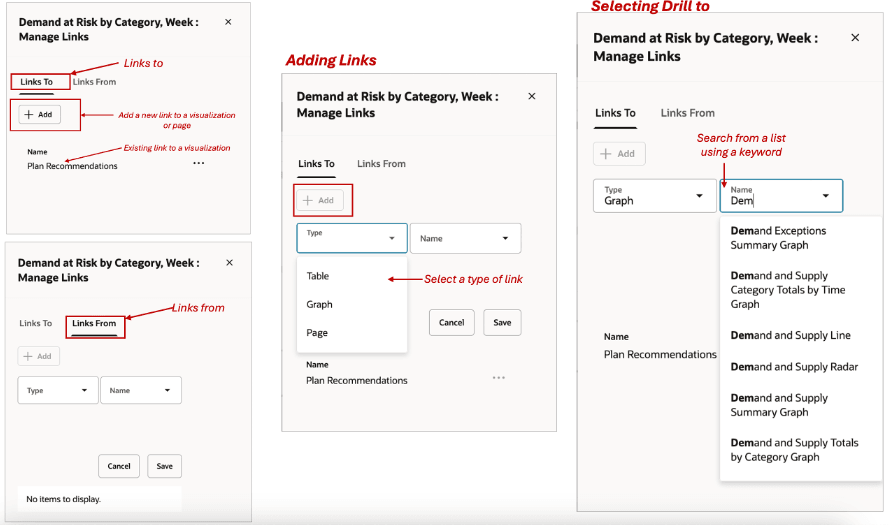
Adding a Link
You can transfer the context of one table, graph, or page layout to another using the following options:
- Enable Dynamic Linking - You will see automatic visual refresh of the data. If selected, then the target table or graph is refreshed when the selections in the source table or graph change.
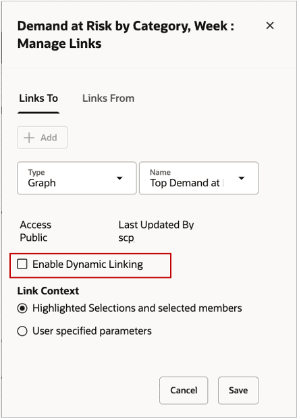
Enable Dynamic Linking
Pass highlighted selections and selected members - If selected, then highlighted content in the current table or graph is passed as the context along with the existing filters to the target table, graph, or page layout.
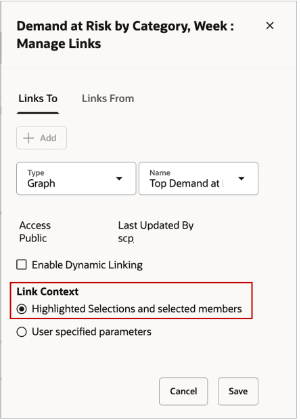
Pass Highlighted Selections
- Pass user-specified parameters - If selected, then the user can specify each dimension’s level and the context of the source table or graph to pass as link parameters to the target table, graph, or page layout.
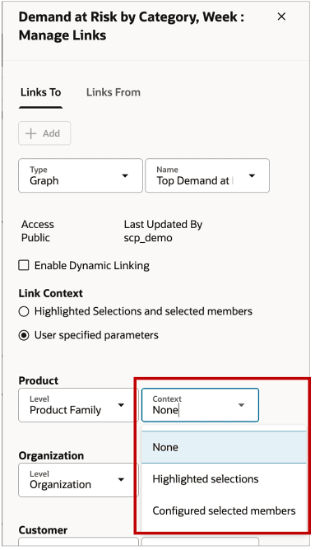
Pass User-Specified Parameters
Highlighted selections considers the selection made by the user. For example, drilling from a cell in a pivot table will preserve the cell’s context. Whereas, configured selected members considers all the members selected in the source visualizations data.
NOTE: Links to external systems, which is a feature in the classic experience that allows you to link a table or graph to a predefined or user-defined analysis or report in Oracle Transactional Business Intelligence (OTBI), Oracle Analytics Cloud, or Oracle Analytics Publisher, isn’t currently supported in the new experience.
Steps to Enable
Use the Opt In UI to enable this feature. For instructions, refer to the Optional Uptake of New Features section of this document.
Offering: Supply Chain Planning
Tips And Considerations
If you want to use the Redwood: Manage Visualizations Using a New User Experience feature, then you must opt in to its parent feature: Replenishment Planning. If you’ve already opted in to this parent feature, then you don’t have to opt in again.
The configuration of the following graph types isn’t supported in the Redwood user experience in 25B release:
- Horizontal Dual Y-Axis Bar Graph
- Horizontal Split Dual Y-Axis Bar Graph
- Horizontal Stacked Bar Graph
- Horizontal Stacked Dual Y-Axis Bar Graph
- Horizontal Stacked Split Dual Y-Axis Bar Graph
- Horizontal Percent Bar Graph
- Absolute Line Split Dual Y-Axis Graph
- Stacked Line Graph
- Stacked Line Dual Y-Axis Graph
- Stacked Line Split Dual Y-Axis Graph
- Percentage Line Graph
- Stacked Area Graph
- Absolute Split Dual Y-Axis Area Graph
- Stacked Split Dual Y-Axis Area Graph
- Percentage Area Graph
- Stacked Combination Graph
- Percentage Radar Graph
- Status Meter Gauge
- LED Gauge
Key Resources
- Refer to What’s New updates for the following features:
- Redwood: Configure Pivot Tables and Graphs Using a New User Experience.
- Redwood: Use Graphs to Analyze Plans Using a New User Experience
- Redwood: Manage Pages and Page Groups Using a New User Experience
- Redwood: Use Pivot Tables to Analyze Plans Using a New User Experience
Access Requirements
Users who are assigned a configured job role that contains these privileges can access this feature:
- Manage Planning Pages (MSC_MANAGE_PLANNING_PAGES_PRIV)
- View Planning Objects (MSC_VIEW_PLANNING_OBJECTS_REST_SERVICE_PRIV)
Manage Planning Pages privilege was available prior to this update. View Planning Objects Using REST Service is a new privilege.