Redwood: Open Product Management Landing Page Using the Product Management Icon
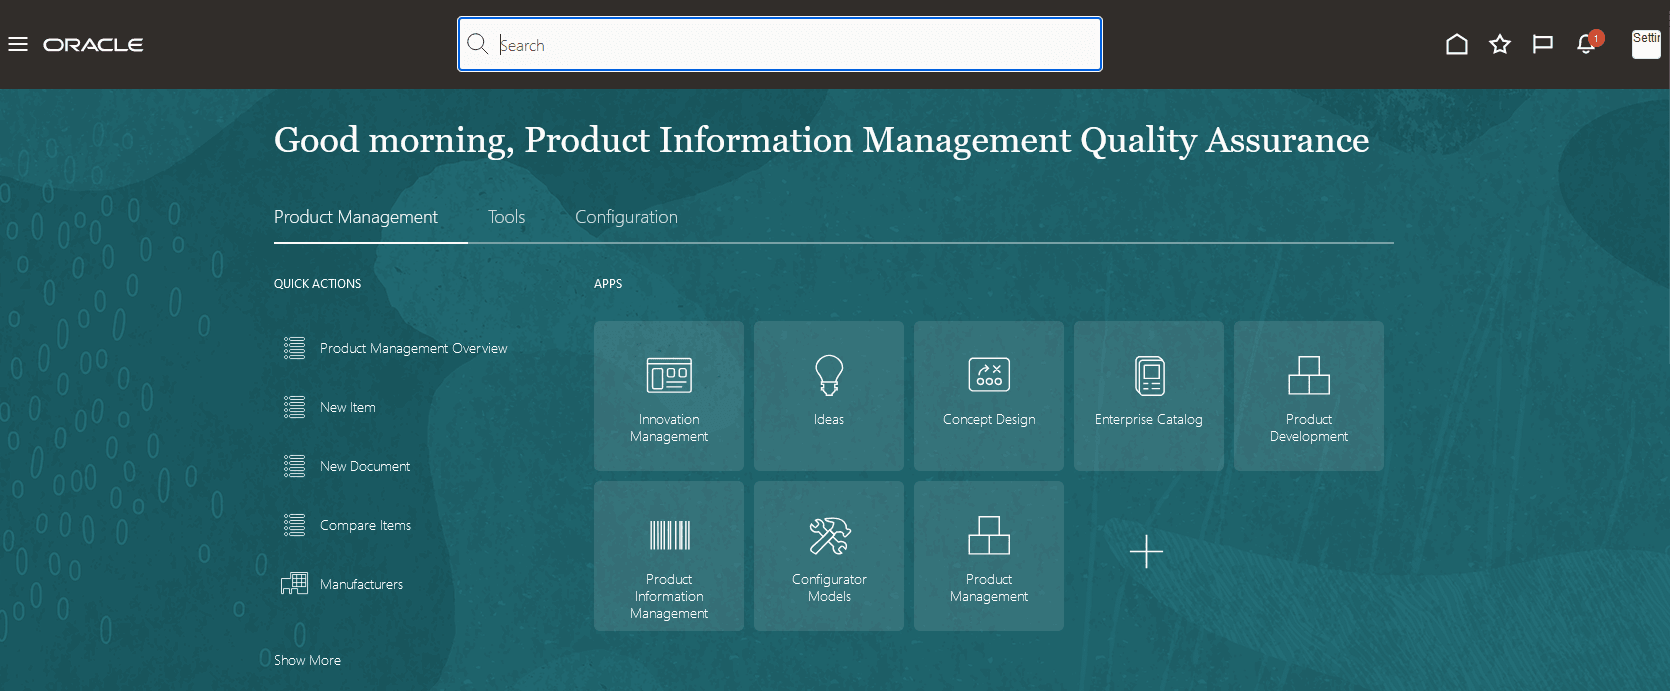
Use the Product Management icon as shown to launch the Product Management landing page.
News Feed
The following screenshot shows the Product Management landing page.
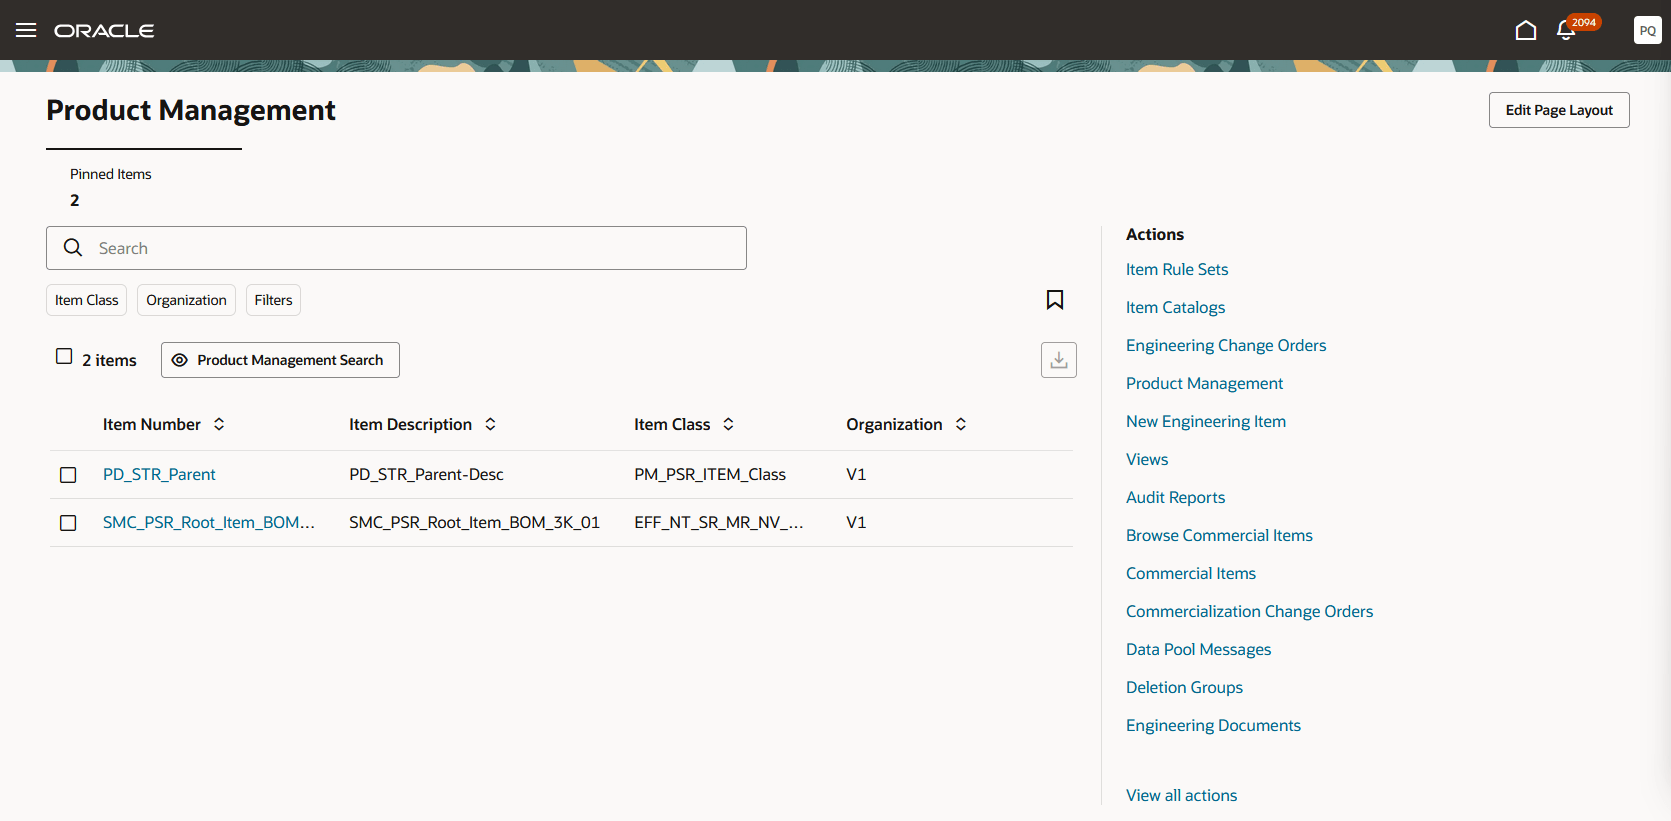
Product Management Landing Page
The Actions region has a list of quick links for navigating to additional pages that may be needed for your daily tasks.
The Actions region contains up to 12 pinned links so that they are always available. The View all actions link at bottom of this region will open the Actions drawer that contains all the actions available to you as shown in the following screenshot. Use the Pin icon to add the action to the Actions region on the Product Management landing page.
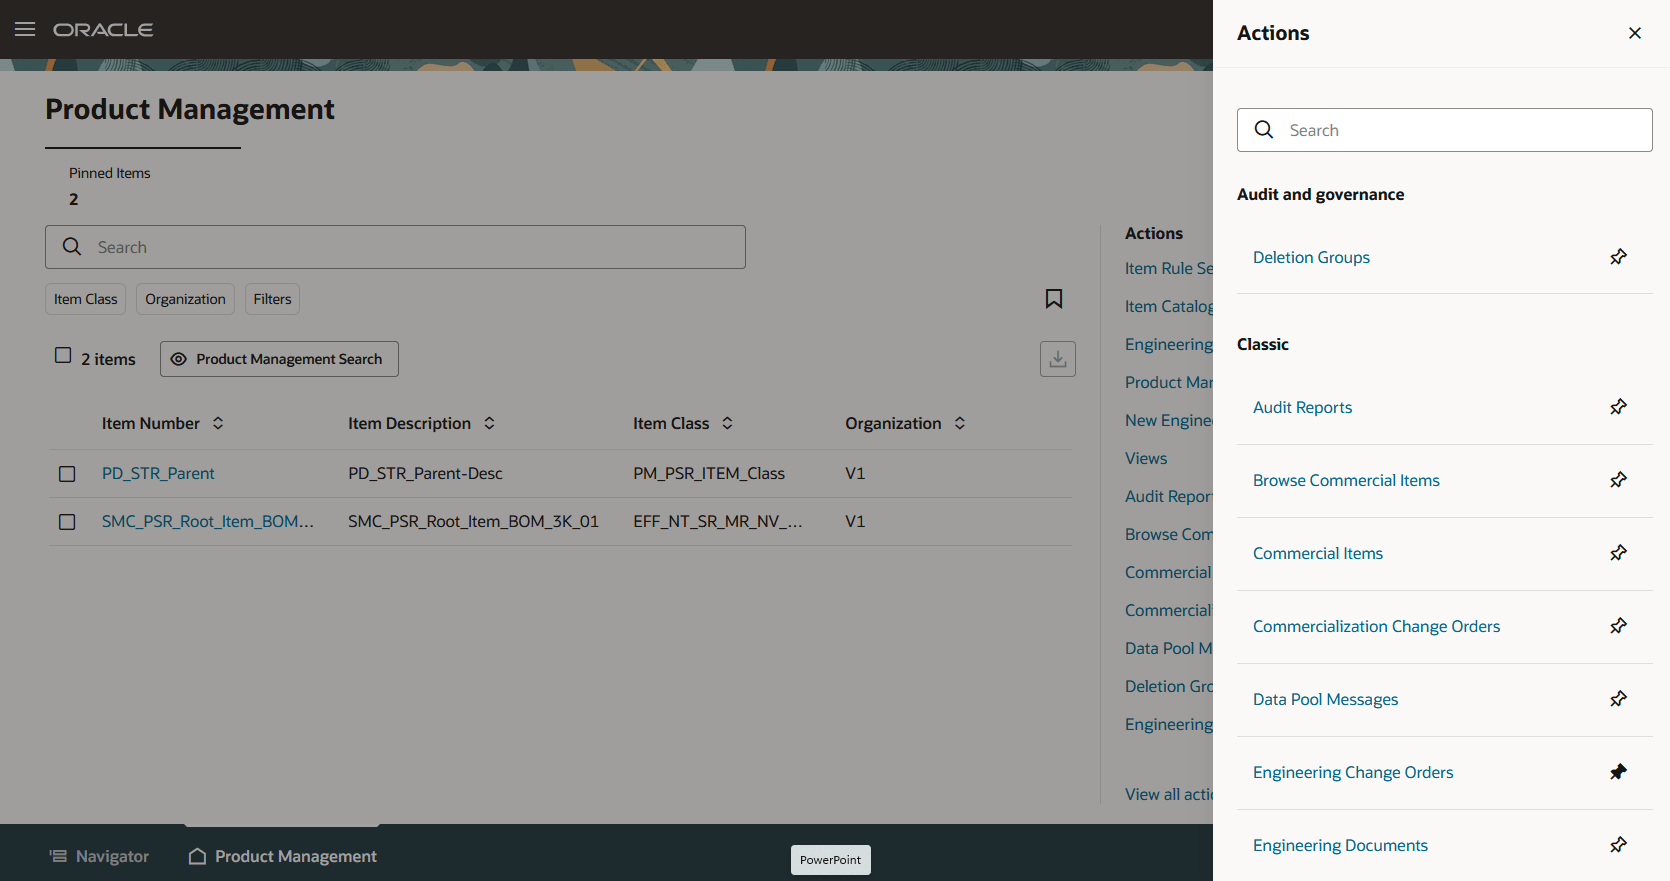
Action Drawer
The region under the page title contains the KPIs and visualizations for the landing page. The KPIs are located directly under the page title in a region called the Scoreboard. The scoreboard can contain up to six KPIs. You can select a KPI in the score board to display the visualizations.
The Visualizations region is directly under the scoreboard and contains three slots, where visualizations can be added. The Pinned Items KPI is using 2 of the 3 slots in the display:
- Pinned Item Table
- Actions
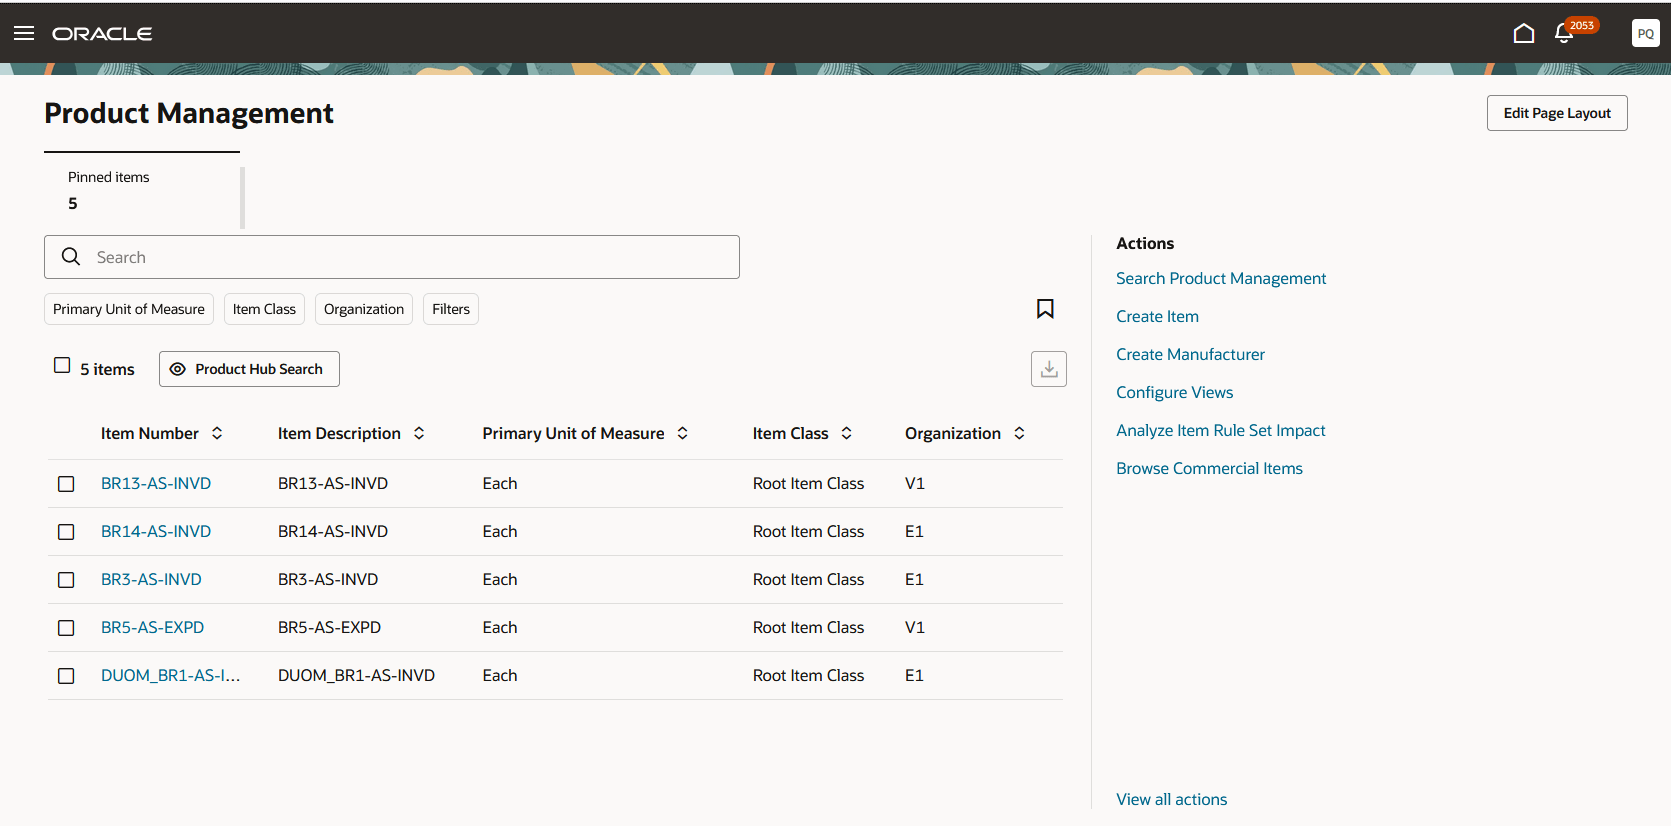
Scoreboard and Visualization Regions on the Landing Page
Create and Manage KPIs and Visualizations
You can define OTBI-based KPIs and visualizations using the Visualization Configurations tool. The steps are:
Step 1: Create an analysis in OTBI and save the analysis in the Share/Custom folder. The following screenshot shows creating OTBI Analysis for your KPI or visualization.
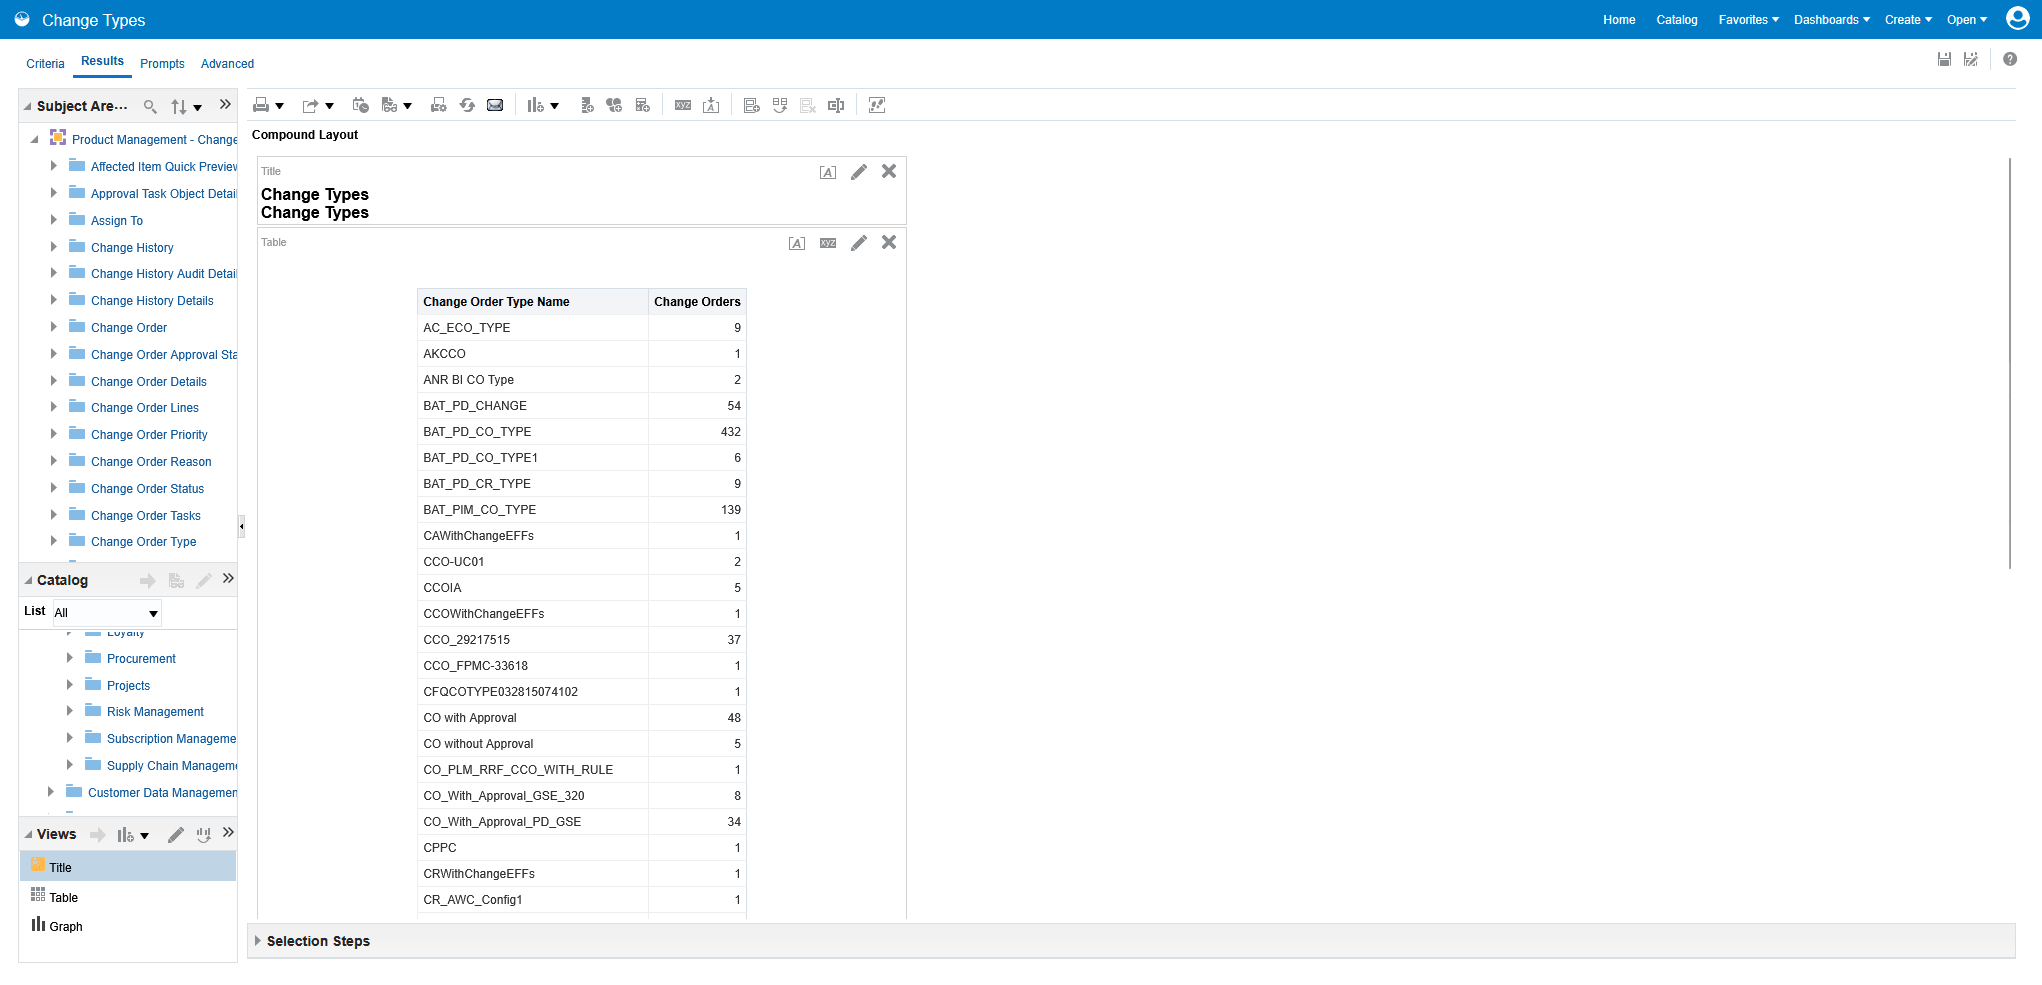
Create OTBI Analysis for Your KPI or Visualization
The last step in the creating an OTBI Analysis is to save the analysis to the Shared > Custom folder as shown in the following screenshot.
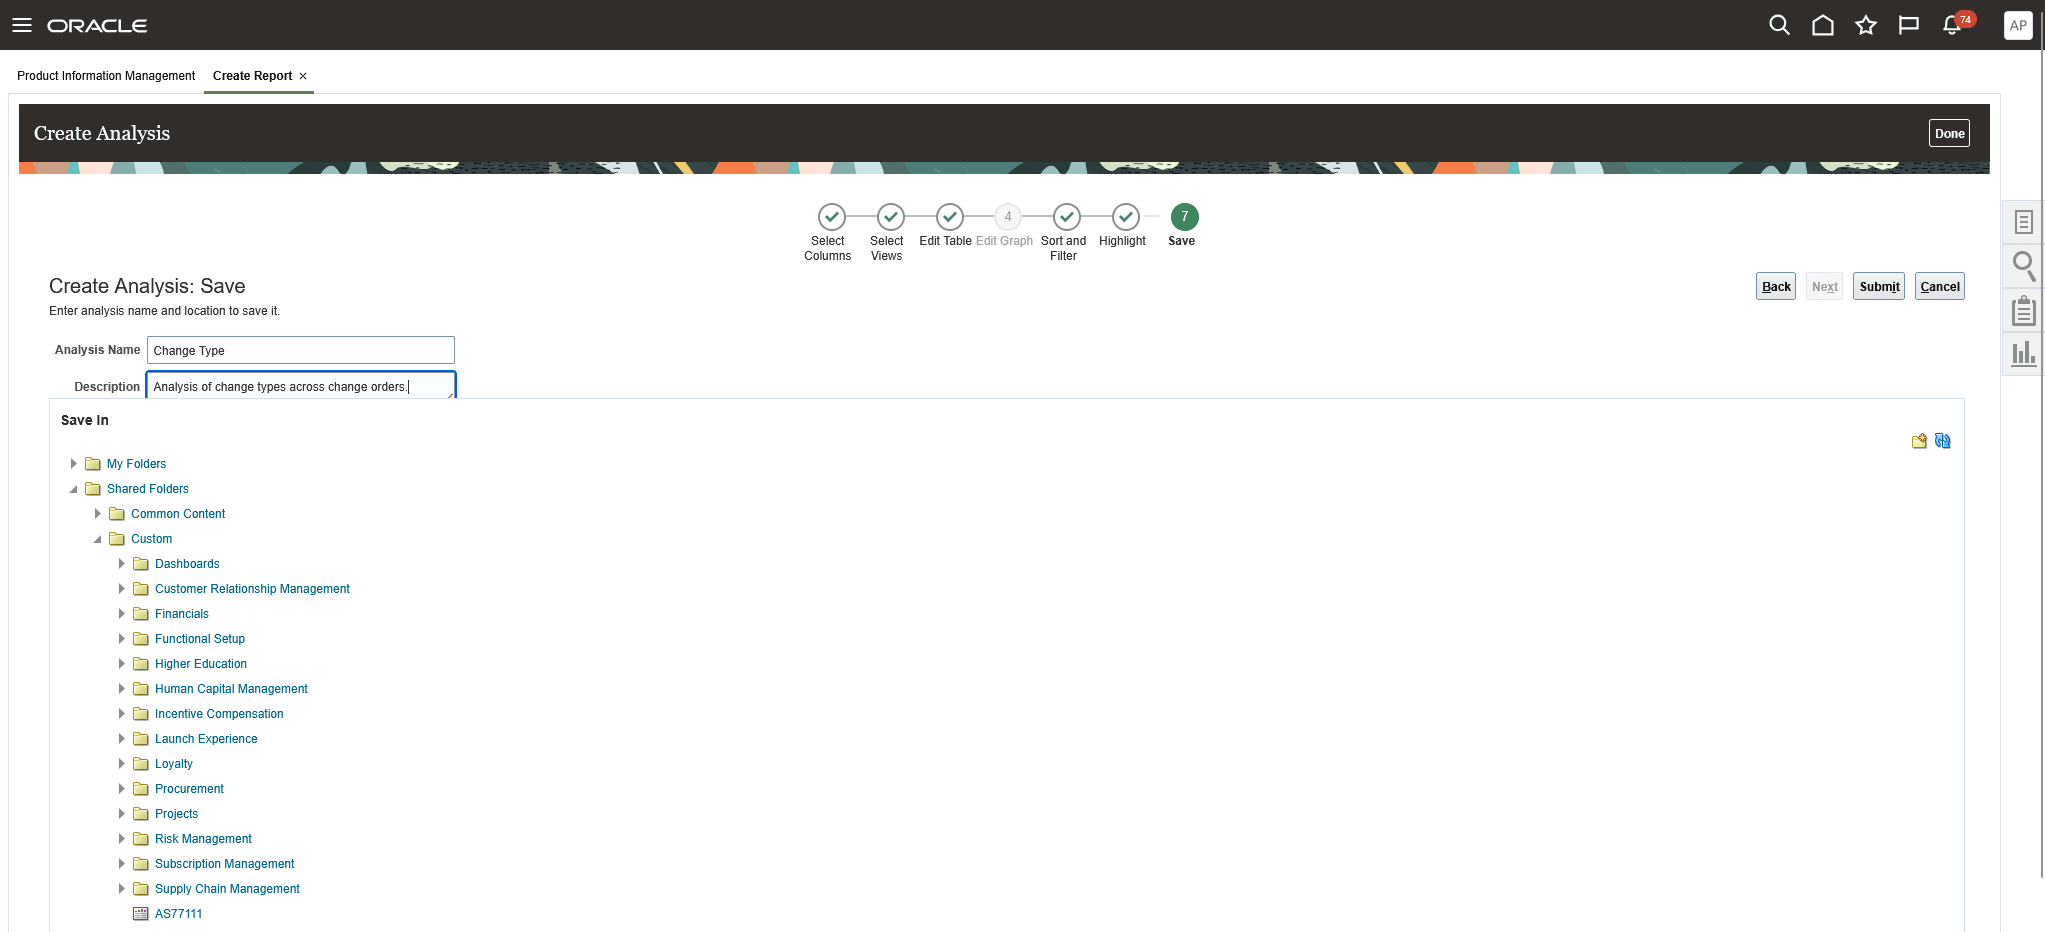
Save the Analysis to the Shared Custom Folder
Step 2: Create KPI
Access the Visualization Configurations tool using the following URL by replacing <Server> with your local server name:
https://<Server>/fscmUI/redwood/cx-analytics/application/container/dvconfig
Click Add to create a KPI. The Create Configuration page is displayed.
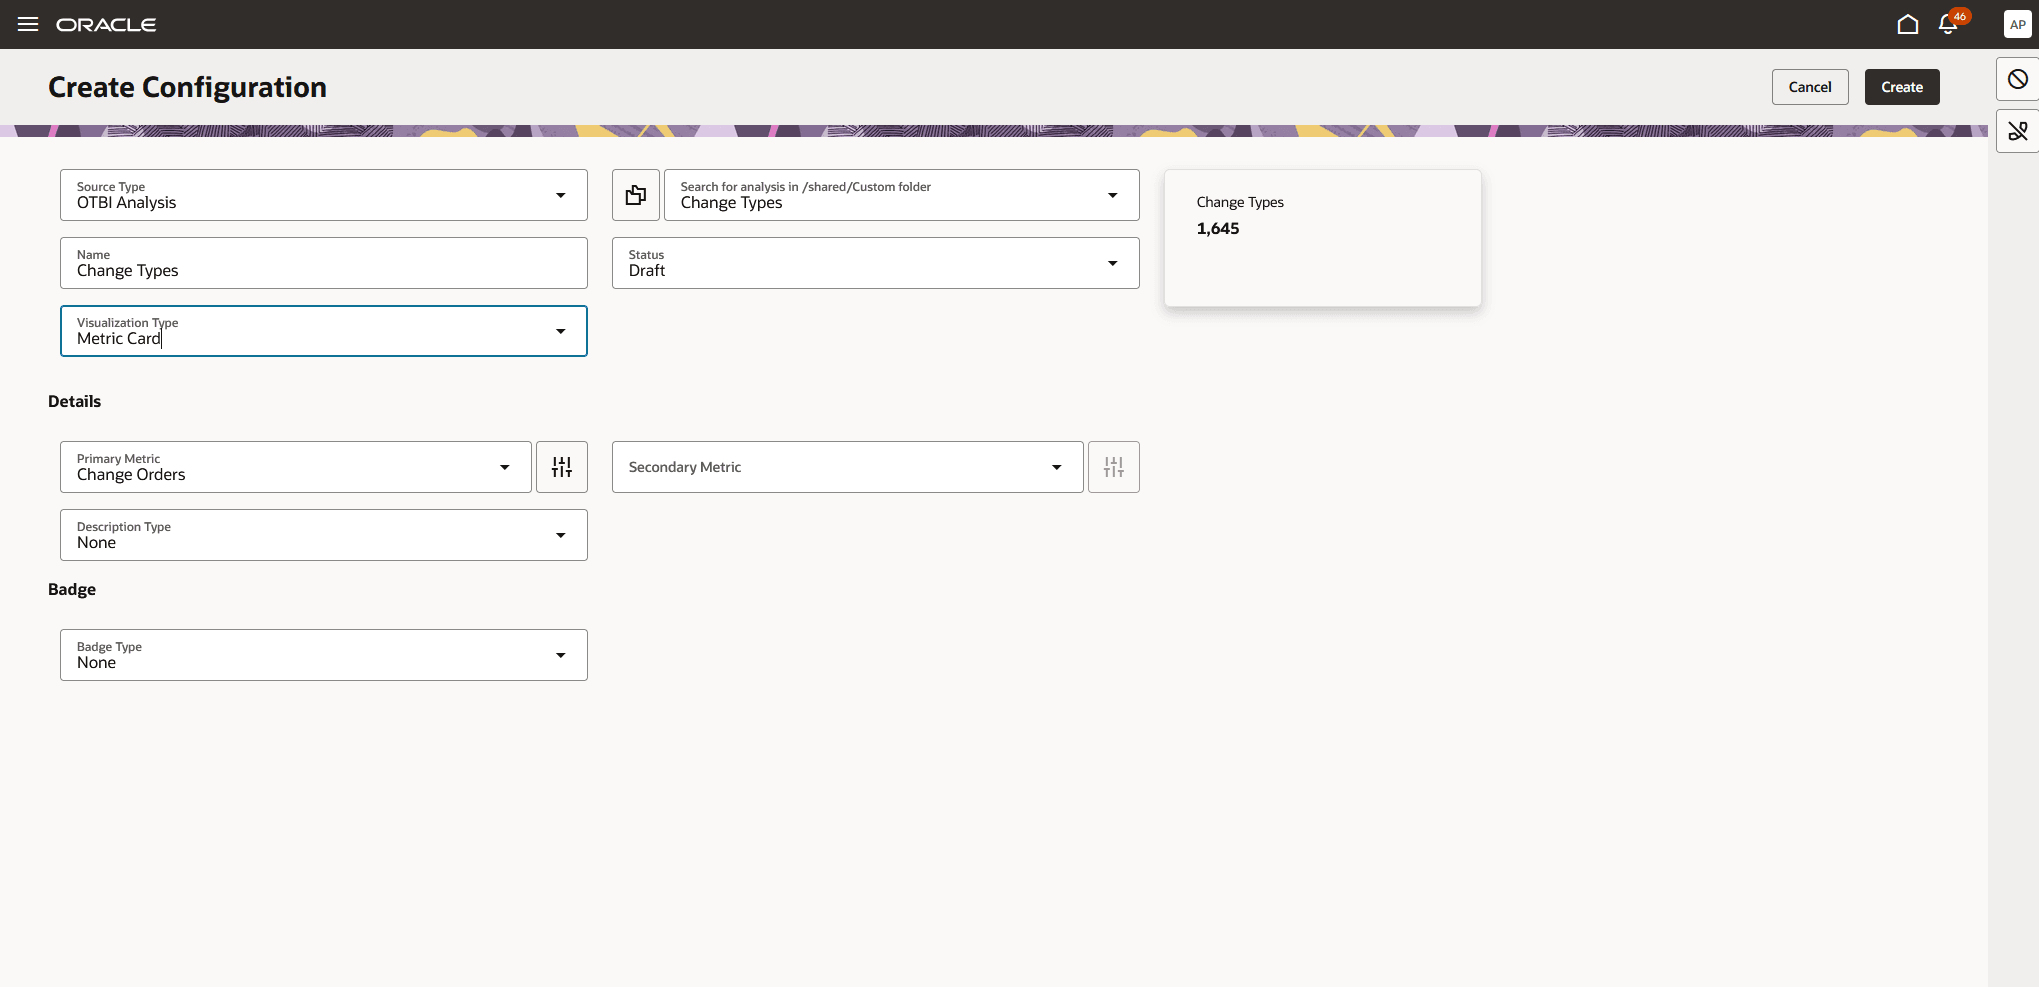
Select Metric Card to Create KPI
Click Create. The KPI is created.
Step 3: Create a visualization
In the same Visualization Configurations tool, click Add. On the Create Configuration page, select Bar Chart, Pie Chart, Tabular Chart, and so on as the Visualization Type and then click Create.
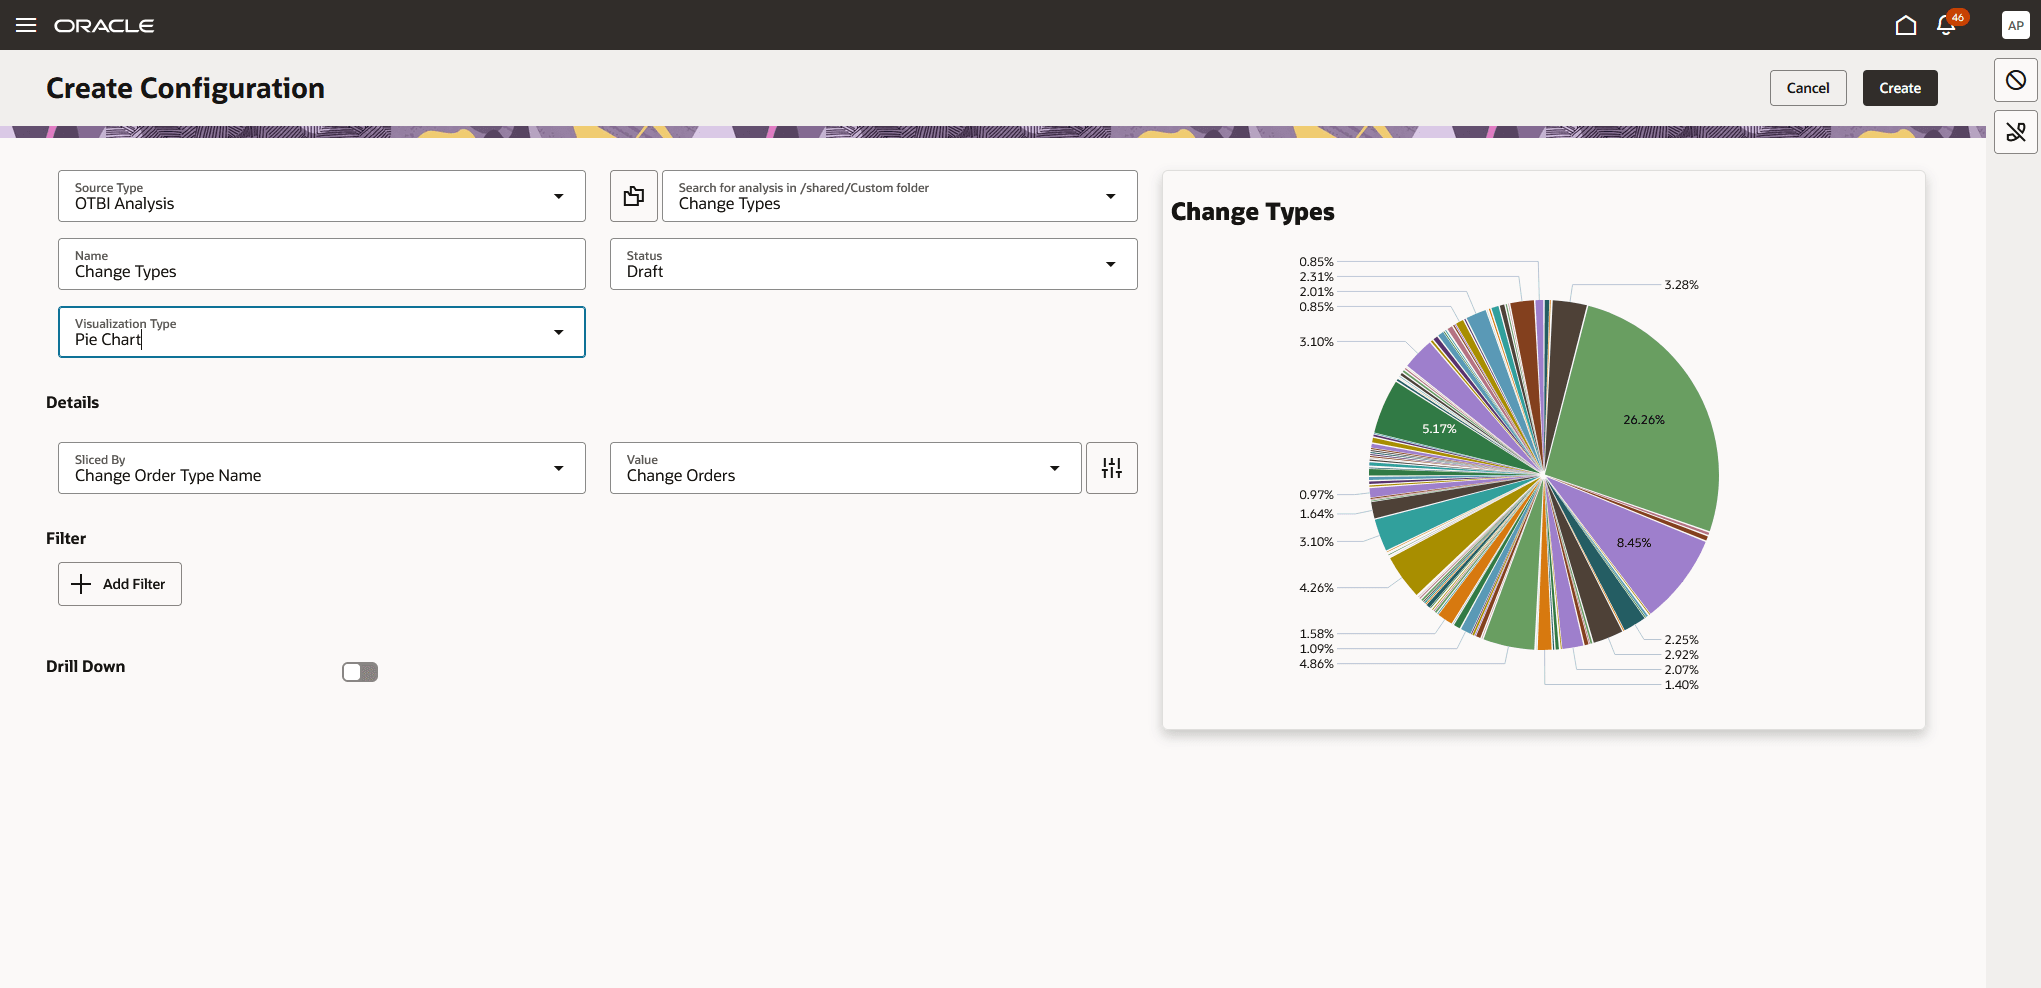
Select Graph or Table to Create a Visualization
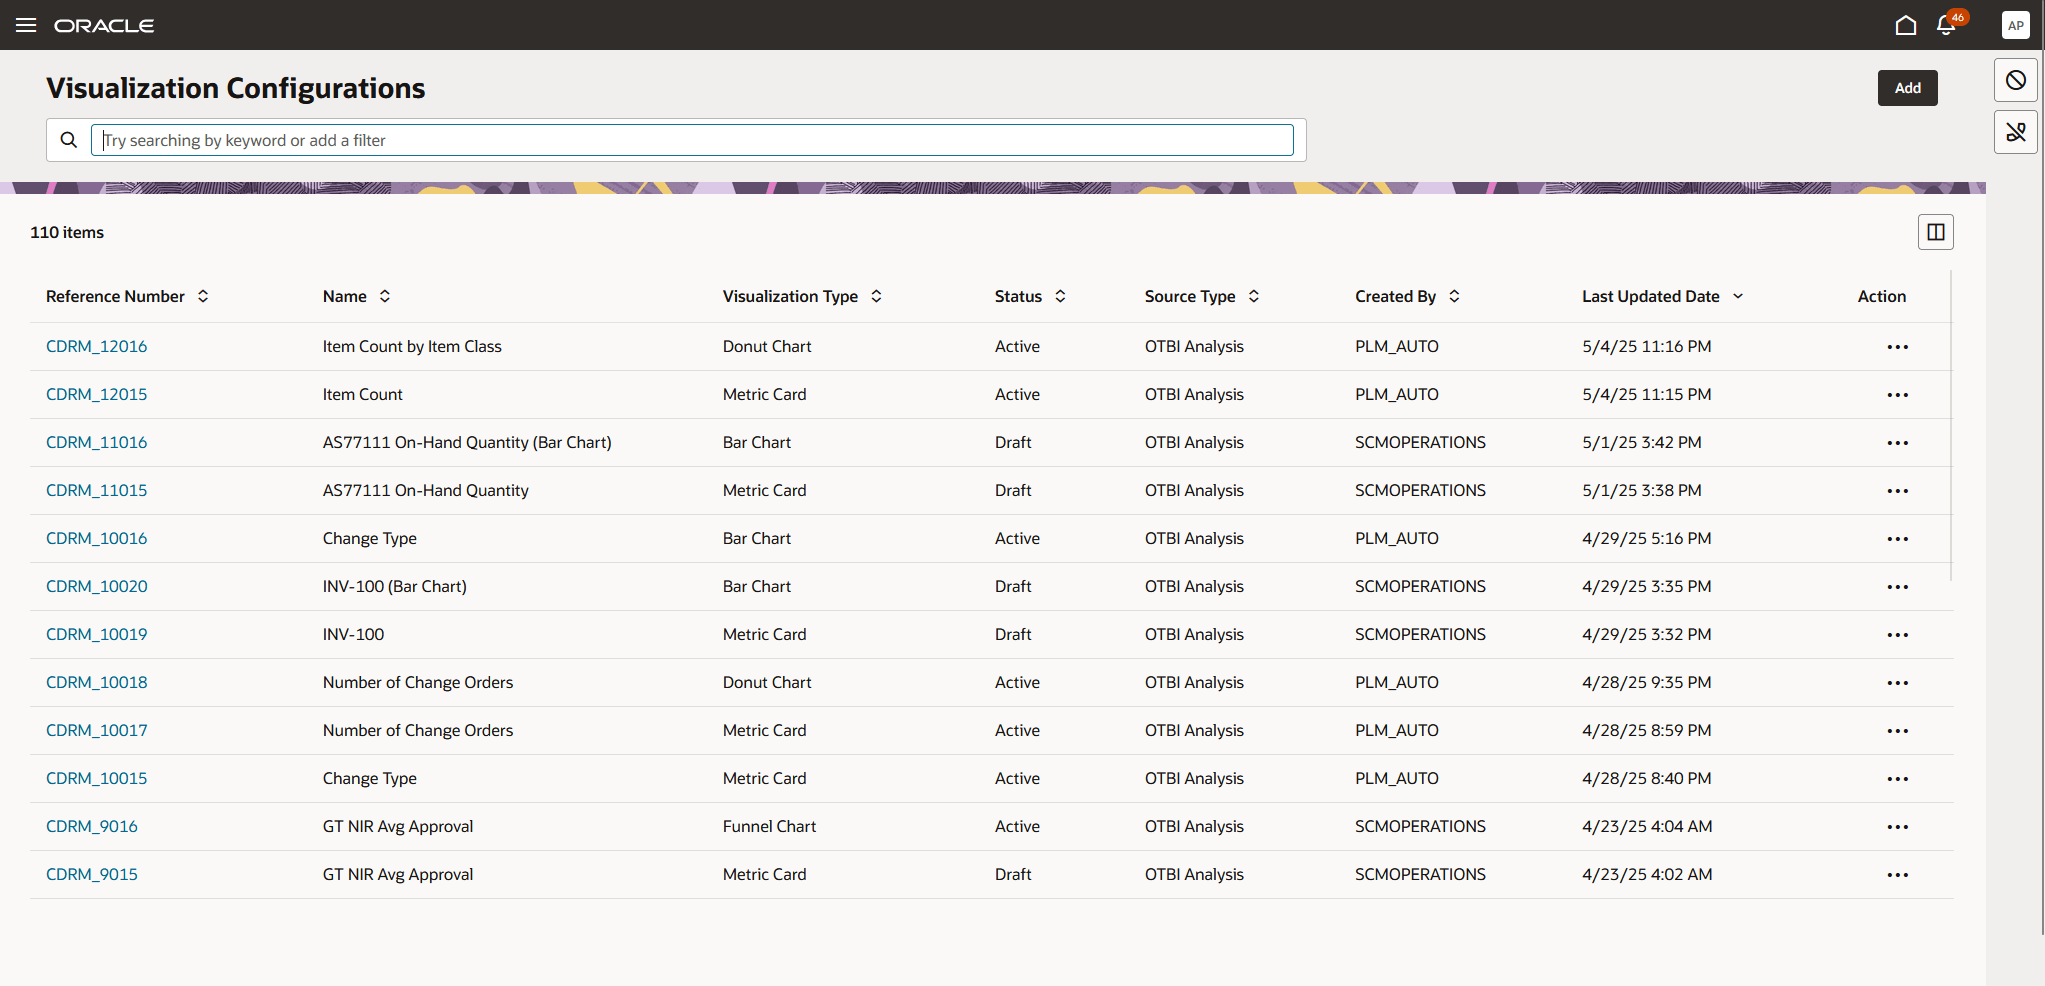
The KPIs and visualizations that are created is displayed on the Visualization Configurations page.
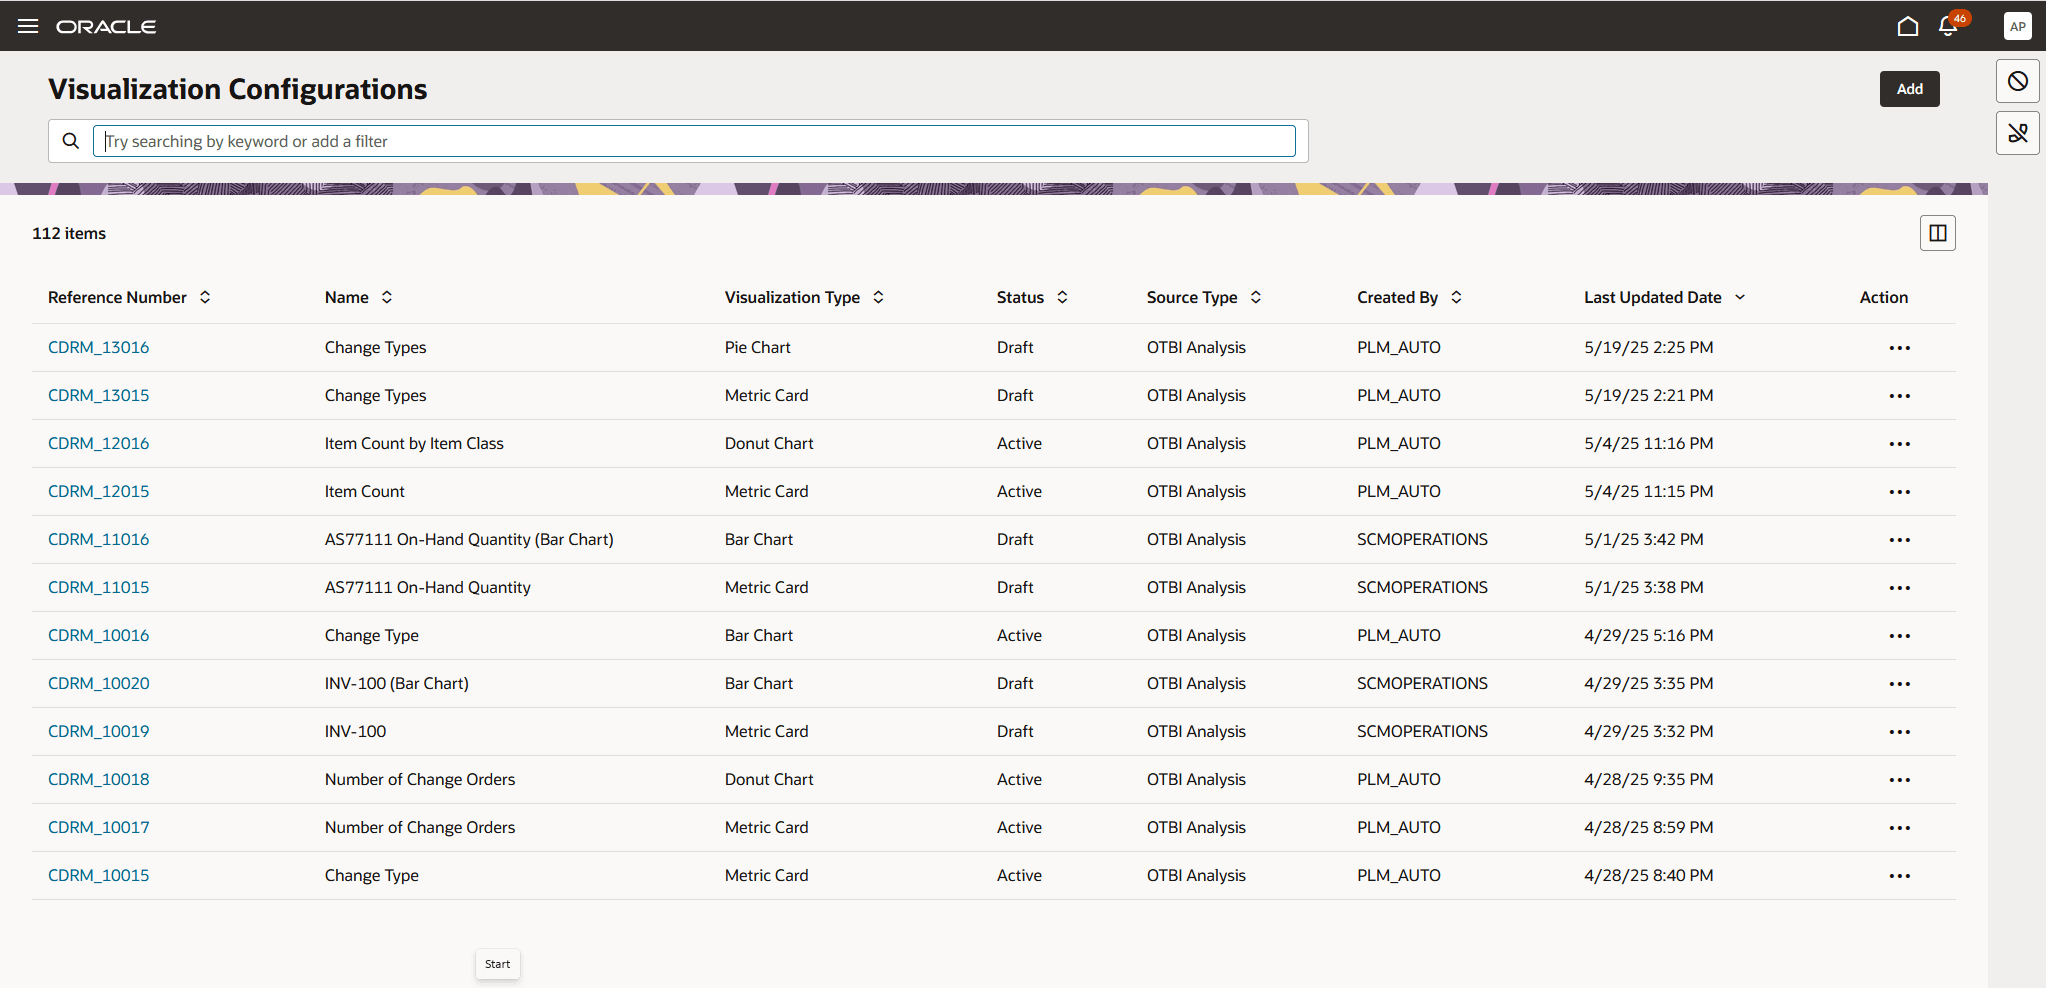
Created KPIs and Visualizations
Adding KPIs and Visualizations To Landing Page
To add your KPI, click Edit Page Layout. In the Library, search for the KPIs or visualizations that you want to add, drag and drop your KPIs or visualizations to the appropriate areas of the landing page, and then click Exit Edit Mode.
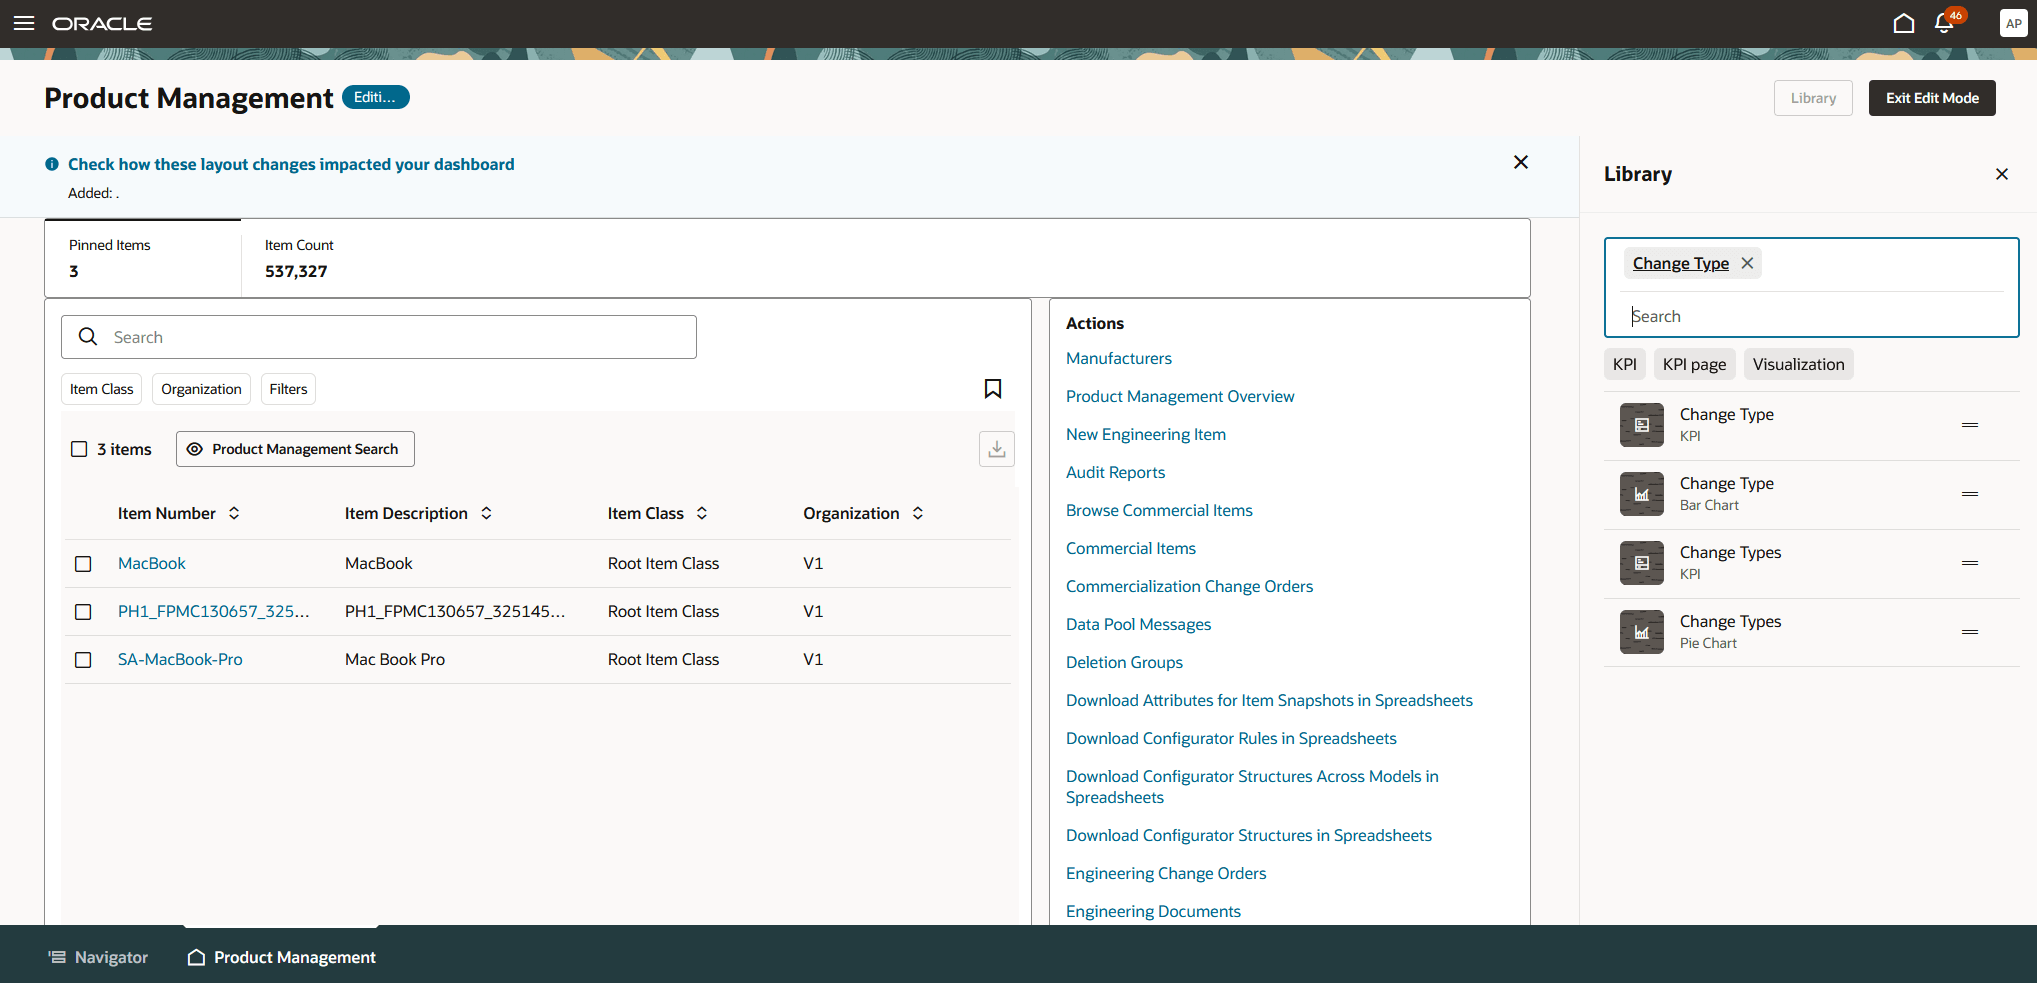
Access KPIs and Visualizations From the Library
The following screenshot shows the selected visualization from the Library.
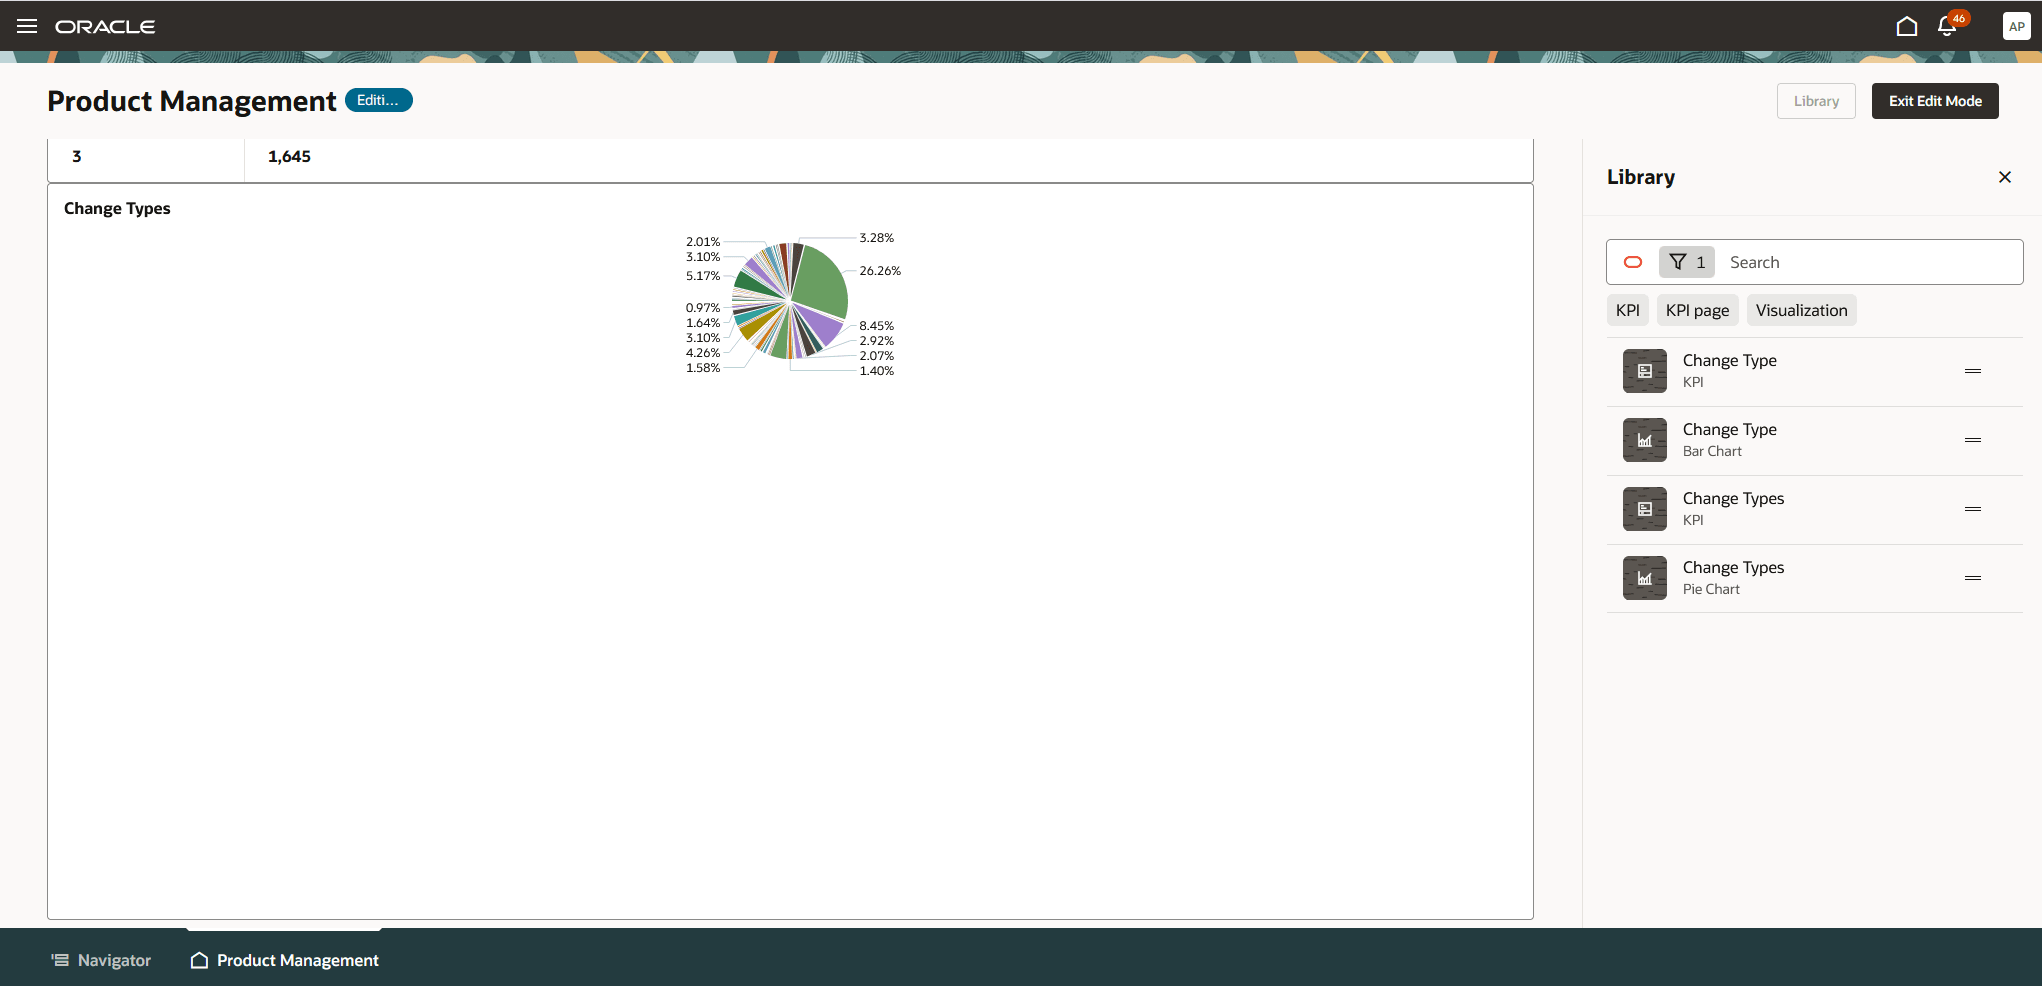
Drag and Drop KPIs or Visualizations to the Landing Page
Remove KPIs and Visualizations From Landing Page
Use the menu on each of KPIs and Visualizations by moving your cursor over the KPI or Visualization and clicking Remove. The Pinned Item KPI and Visualization can't be removed.
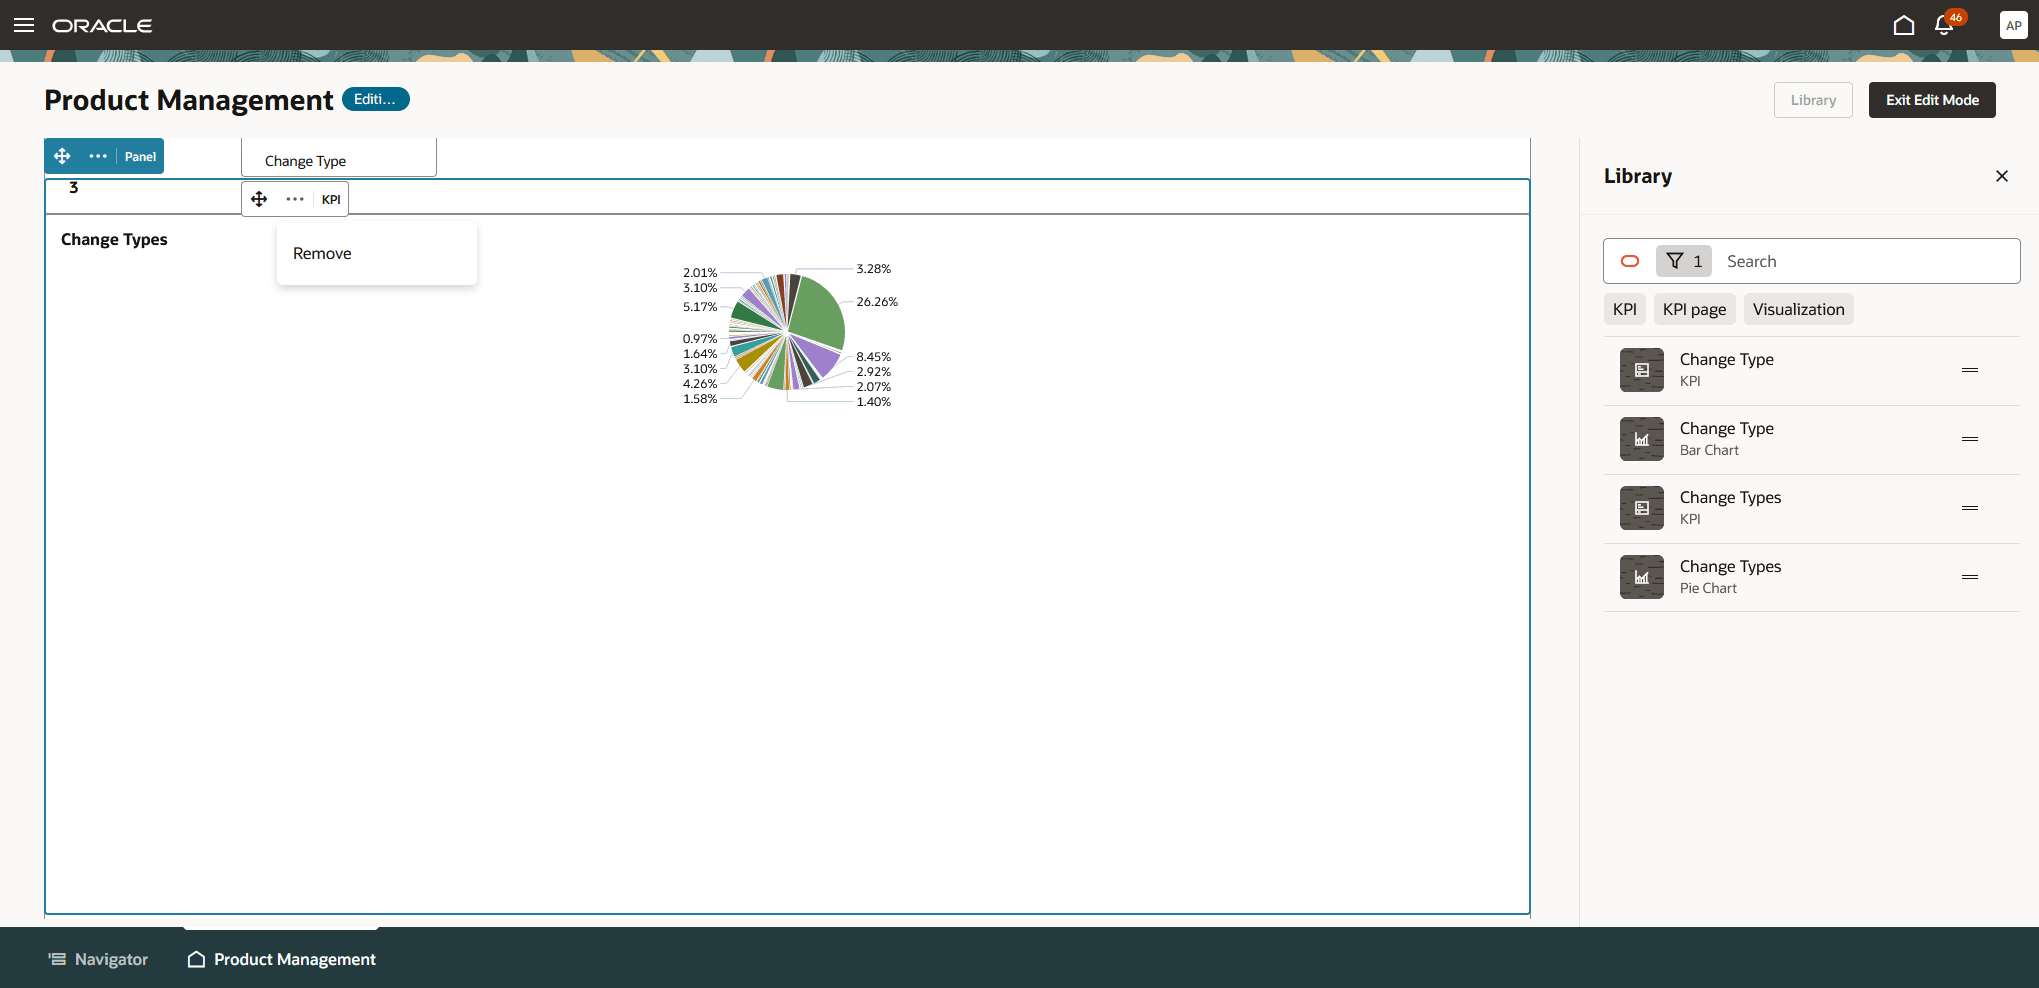
Remove KPI From The Landing Page
This feature benefits your business by providing quick and easy access to the Product Management landing page with seamless navigation to the relevant pages.
Steps to Enable
You don't need to do anything to enable this feature.
Tips And Considerations
- The Actions region contains links to both classic pages, those within the Product Development and Product Information Management work areas in the Classic group and links to Redwood pages in the other groups.
- Classic group actions will open a new browser tab for the page.
Key Resources
- Refer to the Oracle Fusion Cloud SCM: Using Product Master Data Management guide, available on the Oracle Help Center.
- Refer to the Oracle Fusion Cloud HCM: Flexible Reporting in Redwood Dashboards What's New, available on Oracle Help Center.
Access Requirements
Users who are assigned a configured job role that contains this duty and privileges can access this feature:
- Landing Page (ORA_EGP_LANDING_PAGE_DUTY) contains:
- View Item Redwood (ORA_EGP_REDWOOD_VIEW_ITEM_DUTY)
- Product Search (ORA_EGI_PRODUCT_SEARCH_DUTY)
- Access Object Tag Set Repository (ACA_ACCESS_OBJECT_TAG_SETS_PRIV)
- Access Object Tags Repository (ACA_ACCESS_OBJECT_TAGS_PRIV)
- Access Product Management Landing Page (EGP_ACCESS_LANDING_PAGE_PRIV)
- Manage Landing Page Layout (EGP_MANAGE_LANDING_PAGE_LAYOUT_PRIV)
- Access Clipboard (ACA_ACCESS_CLIPBOARD_PRIV)
- Access HCM Common Components (HRC_ACCESS_HCM_COMMON_COMPONENTS_PRIV)
- Manage Search Consumer Applications Rest (EGP_MANAGE_SEARCH_CONS_REST_PRIV)
Users who are assigned these privileges can create and manage KPIs and Visualizations for the landing page:
- Provide access to the Edit Page Layout action
- Manage Landing Page Layout (EGP_MANAGE_LANDING_PAGE_LAYOUT_PRIV)
- Provide access to the Visualization Configurations page
- View Service Manager Dashboard (SVC_VIEW_SERVICE_MANAGER_DASHBOARD_PRIV)
- View Service Representative Dashboard (SVC_VIEW_SERVICE_REPRESENTATIVE_DASHBOARD_PRIV)