Redwood: Use a Default Page Layout to Review Supply Plans
Quickly understanding supply issues in a plan and taking action to resolve is one of the most common interactions with supply planning systems. In this update you can see a sample page layout that facilities this interaction and tailor it to suit your needs.
The default layout provides an at-a-glance view of demand at risk by organization and item category through a treemap visualization. It also enables users to drill down further to identify specific items causing issues within a product category or pinpoint the time buckets in which the issues occur. Additional visualizations enable insights on overloaded resources and inventory issues. A sample material plan visualization is available as a drill down to enable you to understand the complete supply and demand picture in detail.
When you open a supply plan in the Redwood Supply Chain Planning work area, the supply plan overview page group with two tabs is displayed by default. This default page applies to all users, but you can personalize your experience by setting your own default page group for supply plans.
Please refer to What’s New in Redwood: Manage Pages and Page Groups Using a New User Experience to see how you can create a new page and set it as your default page.
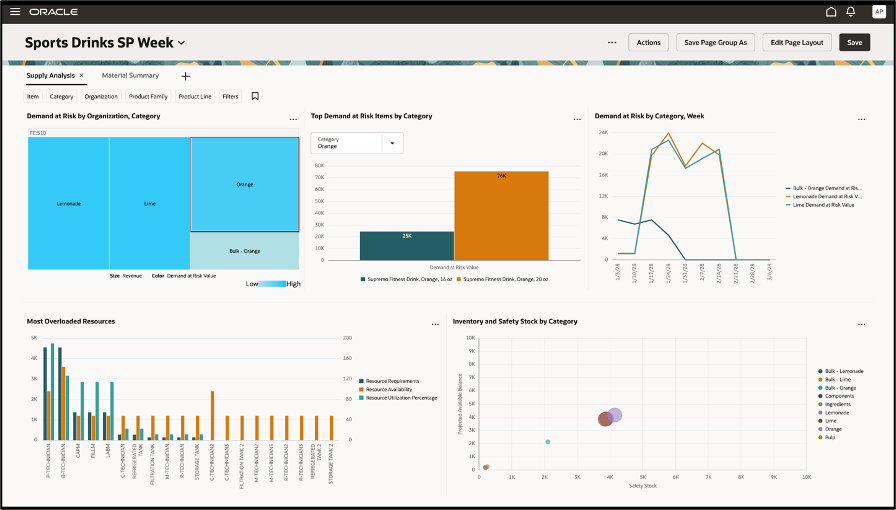
Default Supply Planning Page
The overview page group contains two pages with visualizations:
- Supply Analysis
- Material Summary
The Supply Analysis page includes the following visualizations:
- Demand at Risk by Organization, Category: A Treemap view representing organizations, and product categories (based on the default product hierarchy of the plan's dimension catalog) within each organization showing comparative revenue and demand at risk. This graph uses the new capability available in Redwood user experience to render a treemap based on any two levels across hierarchies such as organization and product category and not necessarily in a single hierarchy.
- The size of the rectangle represents the Revenue. The higher the revenue, larger the rectangle.
- The color of the rectangle represents the Demand at Risk Value that measures the value of the demand at risk due to time, resource, or supply constraints. The darker the color, higher the risk.
- Right-click on any category or organization rectangle to drill to Top Demand at Risk Items by Category or to view the Material Summary.
- Click on a category to see the dynamic change in the adjacent Top Demand at Risk Items by Category graph.
- You can drill from this graph to the following visualizations:
- Top Demand at Risk Items by Category
- Materials Summary page
- Top Demand at Risk Items by Category: A vertical bar graph that represents the top twenty items by value of the Demand at Risk measure for a filtered category. By default, the filter is pre-populated with the first category in alphabetical order.
- The bars represent the demand at risk for different items in the category.
When drilling from the ‘Demand at Risk by Organization, Category’ treemap, the filter is changed to the category which was drilled from.
- Demand at Risk by Category, Week: An absolute line graph displaying the Demand at Risk Value at week level for each category. Each line represents demand at risk value for a different category.
- Most Overloaded Resources – A vertical dual Y-axis bar graph which represents a view of the most overloaded resources in terms of resource requirements along with their resource availability and resource utilization. Resource Requirements and Resource Availability is plotted on the left Y-axis and Resource Utilization Percentage is plotted on the right Y-axis (Y2).
- Inventory and Safety Stock by Category – A bubble graph that highlights any inventory imbalances or anticipated shortages by comparing the safety stock with the projected available balance.
- The size of the bubble represents the projected available balance value.
- The placement of the bubble represents the cross-dimensional view of the Safety stock on X-axis and the projected available balance in quantity on the Y-axis.
The Materials Summary page includes the material plan analysis page.
- The Material Plan is a predefined table in Supply Planning. The Material Plan table is a time-phased view of the demands, supplies, and daily balances across the plan horizon for any item and organization combination.
- The item, organization, and measures are displayed for the row headings, and the time periods are displayed for the column headings.
From the Material Plan table, you can drill down to the Supplies and Demands seeded table and any other user-defined visualization that you can create a link to.
In case of a Demand and Supply Plan, the default page group is the Demand and Supply Overview page group, that includes the addition of the Demand Shipment Analysis page, Supply Plan Analysis, and Material Plan Summary page.
For more details on the content of the Demand Shipment Analysis page refer to What’s New in Redwood: Use a Default Page Layout to Review Demand Plans.
Steps to Enable
You don't need to do anything to enable this feature.
Key Resources
- Refer to the What's New content for the following features:
- Redwood: Manage Pages and Page Groups Using a New User Experience
- Redwood: Manage Visualizations Using a New User Experience
- Redwood: Use Graphs to Analyze Plans Using a New User Experience
- Redwood: Configure Pivot Tables and Graphs Using a New User Experience
- Redwood: Analyze Supply Plans Using a Configurable Redwood Page
- Redwood: Use Pivot Tables to Analyze Plans Using a New User Experience
Access Requirements
Users who are assigned a configured job role that contains these privileges can access this feature:
- Edit Planning Analytics Configuration (MSC_EDIT_PLANNING_ANALYTICS_CONFIGURATION_PRIV)
- View Planning Analytics(MSC_VIEW_PLANNING_ANALYTICS_CONFIGURATION_PRIV)
- Maintain Planning Tables(MSC_MAINTAIN_PLANNING_TABLES_PRIV)
- Delete Planning Tables(MSC_DELETE_PLANNING_TABLES_PRIV)
- View Planning Objects (MSC_VIEW_PLANNING_OBJECTS_REST_SERVICE_PRIV)
These privileges were available prior to this update. The View Planning Objects is a new privilege.