Redwood: Analyze Supply Plans Using a Configurable Redwood Page
This update enables you to use the new Redwood user experience to access, analyze, compare, and simulate a supply plan to optimize your supply chain resources and fulfil demands at the lowest cost. You can use flexible page layouts, advanced searches, plan actions, and relevant tasks to manage demand for your enterprise efficiently.
How to Access the Redwood User Experience
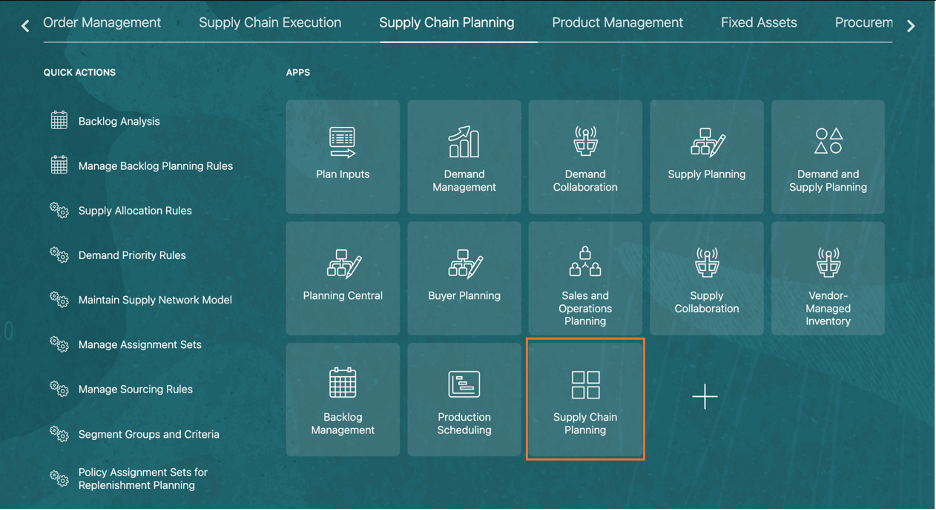
To access the Supply Chain Planning Redwood user experience, navigate to Oracle Fusion Cloud Supply Chain Planning work area and select the Supply Chain Planning module from your Oracle Fusion Cloud application.
This is a common work area that enables access to Oracle Supply Chain Planning applications such as Demand Management, Supply Chain Planning, Sales and Operations Planning, Backlog Management, and Replenishment Planning. The privileges and access rights of the user determine which applications are accessible.
Supply Chain Planning Work Area
Overview
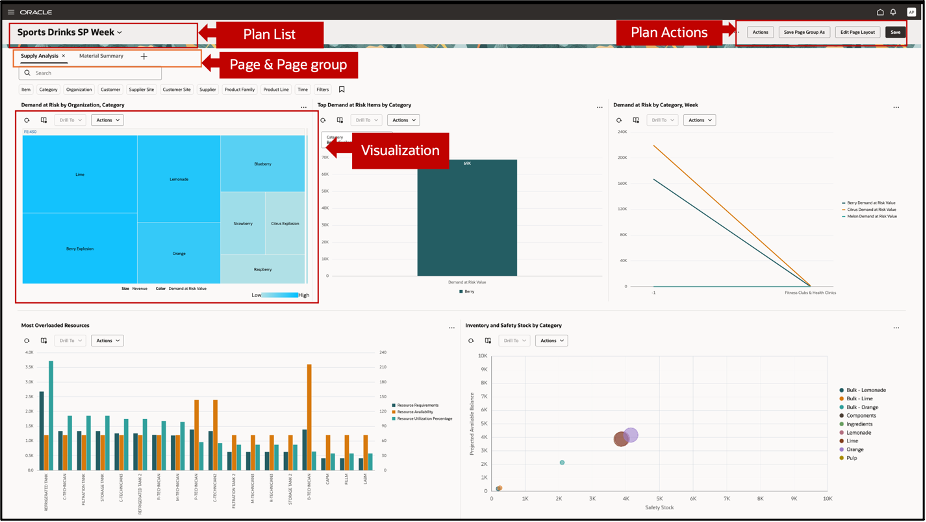
The landing page provides an interactive interface for analyzing data through multiple visualizations. Key components include:
- Plan Selector: Displays the selected plan and a list of all available plans.
- Page & Page Group: Allows navigation between different pages and groups within the plan.
- Plan Actions: Provides options to perform actions on the plan, page, page groups, and page layout.
- Visualizations: Multiple charts and graphs such as a bar chart, bar and line graph, or a scatter plot display various data points
This dashboard allows you to customize and interact with data for better insights and decision-making.
Default Supply Planning Page
Plan Selector: Accessing and managing plans
All plans that have run successfully are displayed in the plan selector list view in an ascending alphanumeric order. The plans with errors or incomplete run state are not accessible from this plan list.
You can search for a plan using keywords such as name of the plan or part of the plan name. You can also search for a plan using the plan type as the keyword. For example, supply plan or demand plan. The default plan that is displayed is the one last accessed through the classic supply planning work area or the new Redwood user experience work area.
The enabled plan types are:
- Demand Plan
- Supply Plan
- Demand and Supply Plan
- Sales and Operations Plan
- Replenishment Plan
Additionally, the plan selector allows you to switch to view Backlog Management, Plan Inputs, Simulation Sets and Planning Cycles used in Sales and Operations Planning.
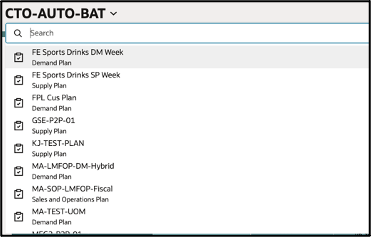
Plan Selector
After you select a plan from the list, a default page group for that plan type is displayed. Each plan type has its own default page group.
Managing Plans
Perform various actions and manage your plans through the Actions menu on the toolbar. The types of actions are displayed based on your access and security privileges.
You can perform the following actions by clicking using the Actions menu:
-
Plan Actions
-
Archive Plan: Archive a plan.
-
-
Pages and visualizations
-
Planning Pages: View a list of all the available pages.
-
Planning Visualizations: View a list of all available visualizations.
-
- Plan Inputs
- Plan Inputs
- Planning Calendars
- Production Plans
- Segment Groups and Criteria
- Supply Chain Planners
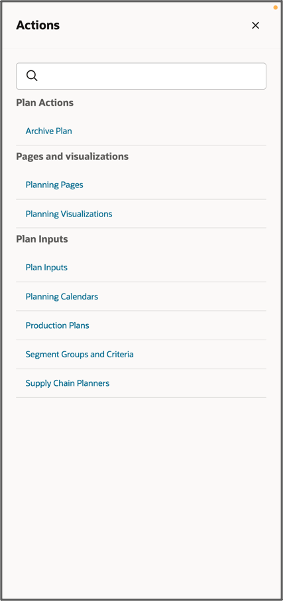
Actions Menu
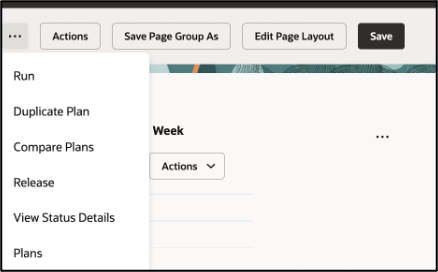
More Actions
You can perform the following operations on a plan using the More Actions menu.
- Run
- Duplicate Plan
- Compare Plans
- Release
- View Status Details
- Archive Plans
More Actions Menu
Comparing Plans
You can compare the current plan with other plans to visualize different planning outcomes and make planning decisions. You can select up to 3 plans to compare. The graphs of the same measure from the selected plans are shown in a single row.
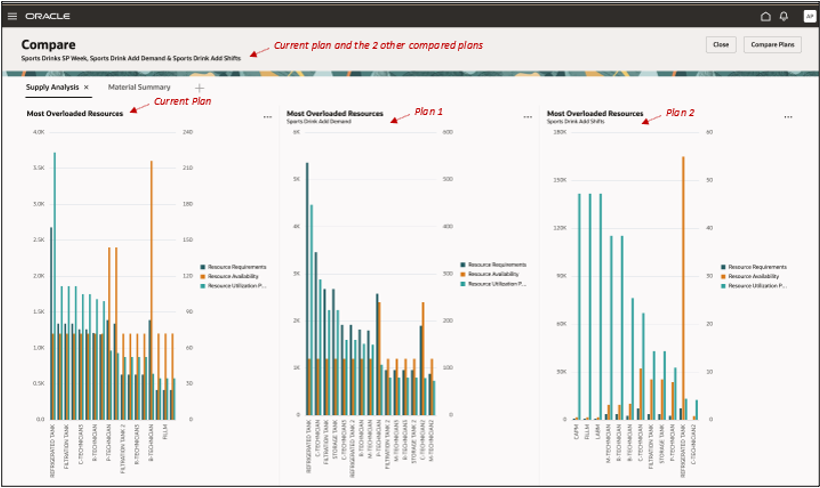
Layout of a graph in Comparison Mode
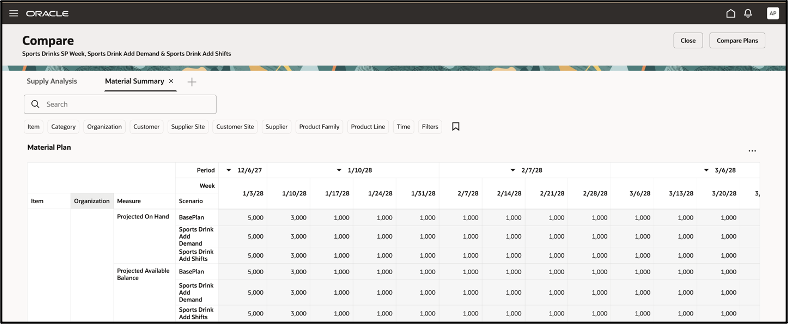
Layout of a Pivot Table in Comparison Mode
Note: Compare mode is not supported for standard tables such as Supplies and Demands table and Gantt chart.
Page and Page groups
A Supply Planning work area is made up of a set of pages containing several visualizations. You can switch between multiple pages organized as tabs. You can group these pages known as page groups for use in specific types of analysis such as exceptions and late demands.
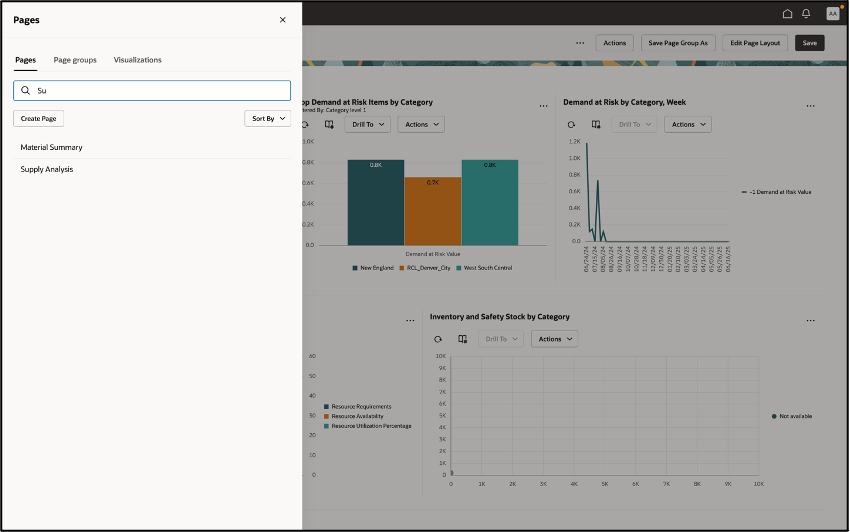
Searching for a page
You can search for an existing page you created or of another user to display it or add to a page group. Search a page by a keyword or use the Sort By option to filter pages by name or description. The names of public pages of all the users and your private pages are displayed
Creating a new page
- Click the + sign on the tab to open the Pages drawer.
- On the Pages drawer, click Create Page.
- In the Create Page window, enter the name, description, and access type.
- Click Continue.
- In the editing mode of the page, drag and drop graphs and tables from the content library.
- Select Save.
Pages Drawer
Duplicating a page
You can duplicate a page using the Save page as option in the Edit Page Layout menu. Duplicating a page creates a new copy of the page but the visualizations belong to the original owner of the page.
Removing a Page
You can remove a page by clicking on the close icon on the page tab. If you remove a page, you might also want to save the changes you made to a page group. Click Save Page Group As on the menu to save the changes.
Modifying Page Groups
To modify the content of a page group, drag the pages to change the order of the pages in the page group. You can set a personalized page group as the default for a plan type.
Visualizations
You can add tables and graphs into your page layout from the content library. Use the Edit Page Layout option to change how visualizations are displayed. Add up to four visualizations per row and you can create multiple rows. Rearrange the visualizations on a page by dragging and dropping them between two other visualizations or on top of another visualization and then save the modified page. The page adjusts automatically to a new layout.
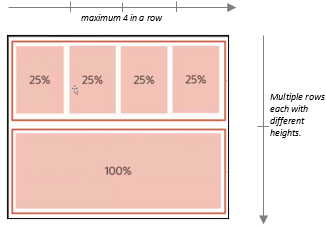
Visualizations Arranged in 2 Rows
Managing a visualization
You can add or remove visualizations, modify their properties, and rearrange them in a different layout on the page. A visualization’s properties such as name, description, work area type, data and the layout can be defined.
Use the Actions menu to do the following:
- Edit the properties of a visualization such as name, description, and work area type.
- Edit the data such as measures, hierarchies, and member filters. The measures and hierarchies displayed depend on the current open plan. For example, a demand plan has different measures, hierarchies, and member filters in a table as compared to a supply plan.
- Edit the layout of the visualization.
- Show or hide the toolbar of the visualization.
- Link a table or a graph to another table or graph or a page layout using the Manage Links option. The links enable you to pass the context of a table or graph to another table, graph, or a page.
For more details on editing the properties, refer to What’s New in Redwood: Configure Pivot Tables and Graphs Using a New User Experience.
Changing the visualization layout properties
You can customize visualizations easily using the options available in the Actions menu.
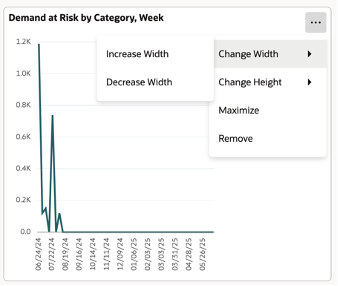
Visualization Layout Properties
Use the Actions menu to:
- Change dimensions: Increase or decrease the height and width of the visualization as per your requirement The default height of a visualization is 1 unit. You can maximize it to 2 units.
- Maximize: Maximize each visualization to occupy the full width and height of your viewport.
- Remove: Remove the visualization using this option or by dragging it back to the content library.
Here's the demo of these capabilities:
Steps to Enable
The following site-level profile should be enabled:
- Redwood Supply Planning Pages Enabled (ORA_MSC_SUPPLY_PLANNING_REDWOOD_ENABLED)
Tips And Considerations
- Limitations of Visualizations: The maximum number of visualizations supported in a user session are controlled by the profile option ORA_MSC_REDWOOD_MAX_VISUALISATIONS. This is the maximum number of visualizations across all the pages in the current session.
By default, maximum visualizations are 20. However, most pivot tables and large graphs consume a lot more memory than simpler graphs. Hence it is recommended to keep the number of visualizations in a single page group less than 10 to experience enhanced performance.
- If you don’t have any active plans accessible at the time, or if your planning environment is undergoing configuration changes, no content would be visible. The Actions menu and planning tasks will be accessible.
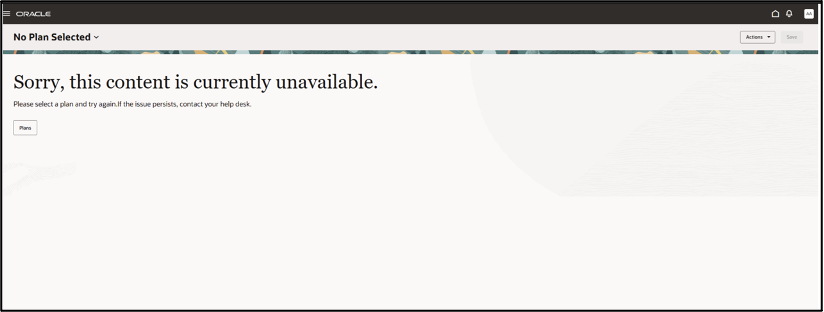
Content Unavailable
- When comparing plans for standard tables, such as a Supplies and Demands table, the comparison doesn’t look the same as it does for pivot tables. For example, the items in the base plan appear to be repeated in the new table and do not display the relevant data. This is a known issue.
- You won’t be able to do the following in a graph visualization in the compare mode:
- Access the graph’s toolbar actions.
- Perform a drill action on the graph.
- Edit properties and add links.
- You won’t be able to do the following in a pivot table visualization in the compare mode:
- Modify the data in the pivot table such as editing cell values and changing or refreshing the layout of the table.
- Edit notes and change visualization properties.
- Changing the dimensions of the visualization.
- Some actions related to setups and configuration are not yet available in the Redwood user experience but will still be available in the classic user experience.
Key Resources
- Related What’s New features for reference:
- Redwood: Configure Pivot Tables and Graphs Using a New User Experience. Redwood: Use Graphs to Analyze Plans Using a New User Experience
- Redwood: Manage Visualizations Using a New User Experience
- Redwood: Manage Pages and Page Groups Using a New User Experience
- Redwood: Use Pivot Tables to Analyze Plans Using a New User Experience
- Redwood: Use Graphs to Analyze Plans Using a New User Experience
Access Requirements
Access to the Redwood Supply Chain Planning work area are determined through the privileges granted. Users must have access to the following privileges via any seeded job roles or custom roles:
-
- MSC_MONITOR_PLAN_INPUTS_WORK_AREA (enables access to work area and enables 'Plan Inputs' and 'Simulation Sets' in the plan switcher)
- MSC_MONITOR_DEMAND_AND_SUPPLY_PLANNING_WORK_AREA (enables access to work area and enables all Supply Plans, Demand Plans and Demand and Supply Plans in the plan switcher)
- MSC_MONITOR_SUPPLY_PLANNING_WORK_AREA (enables access to work area and enables all Supply Plans in the plan switcher)
- MSC_VIEW_PLANNING_OBJECTS_REST_SERVICE_PRIV (View Planning Objects Using REST Service)
View Planning Objects Using REST Service is a new privilege. - FND_SEARCH_FWK_MGR_PRIV (Grant Search Framework Manager Permissions)
- FUN_FSCM_REST_SERVICE_ACCESS_INTEGRATION_PRIV (Access FSCM Integration Rest Service)