Redwood: Analyze Sales and Operations Planning Plans Using a Configurable Redwood Page
Use the Redwood user experience to access, analyze, compare, or simulate a sales and operations planning plan. You can configure your user experience by using flexible page layouts, advanced searches, plan actions, and tasks. Use visualization capabilities to configure graphs and tables.
To access the Redwood Supply Chain Planning work area, navigate to the Supply Chain Planning landing page and select the Supply Chain Planning work area.
This Redwood work area enables access to Supply Chain Planning applications, including Demand Management, Supply Planning, Sales and Operations Planning, Backlog Management, and Replenishment Planning. A user’s privileges and plan access determine which applications are available.
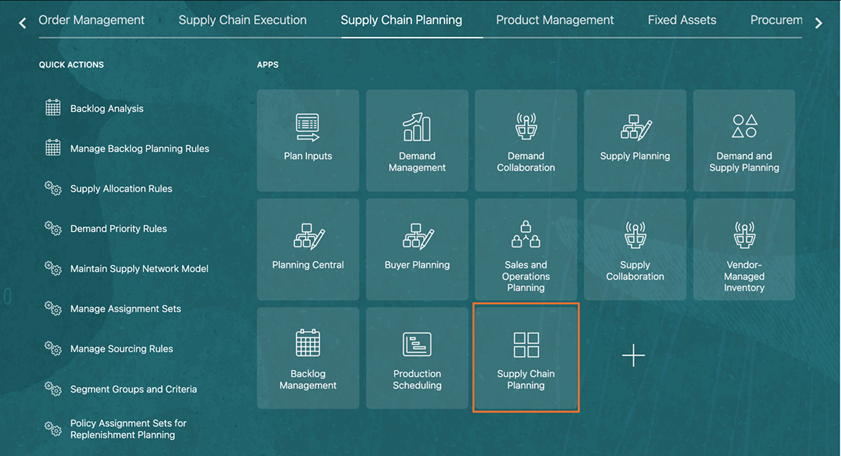
Supply Chain Planning Landing Page
You can access your plans from the plan selector. The plan selector displays only plans that have run successfully. Plans with an error status or those that haven’t run yet are available in the Redwood Plans page.
The plan selector is searchable by keyword. The default plan is the most recently opened plan, either from the Sales and Operations Planning work area or the Redwood work area. You can also search for plans by using the plan type as keyword.
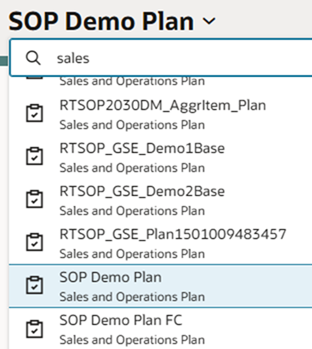
Filtered List of Sales and Operations Plans
Selecting a plan opens the default page group associated with that plan type. For sales and operations plans, the default page group is named Executive Review Plan Summary.
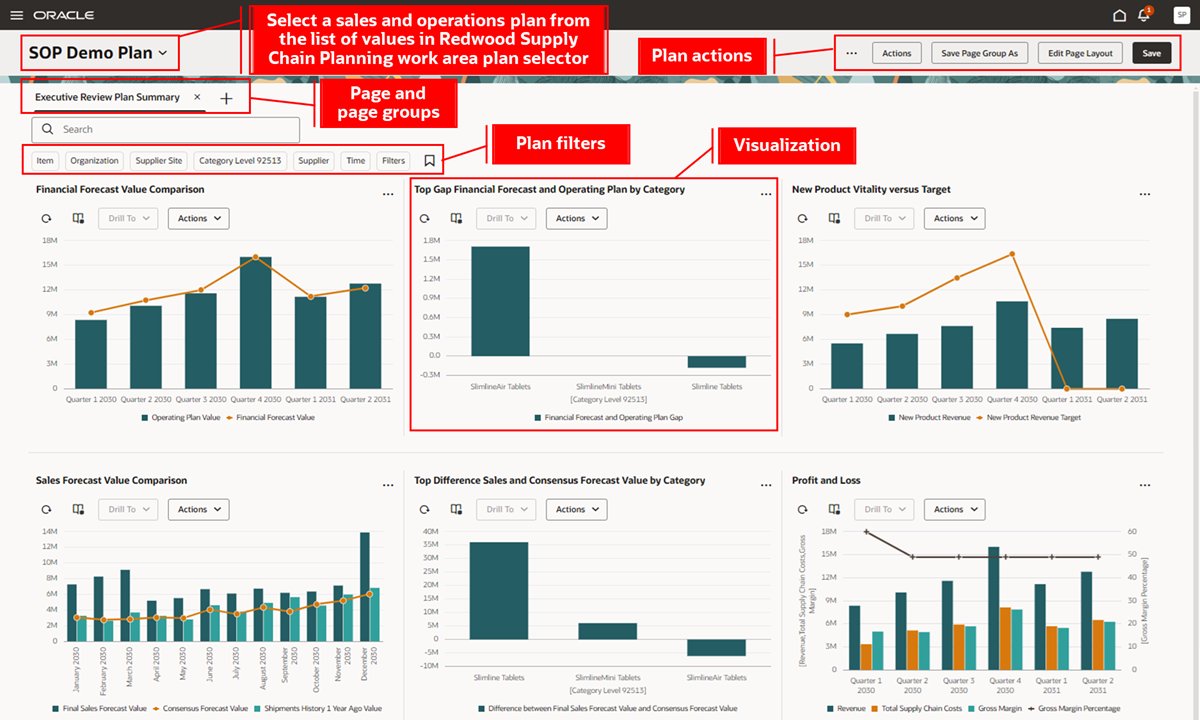
Default Executive Review Plan Summary Page Group
Use the plan filters to quickly filter the page by dimension levels, including product category.
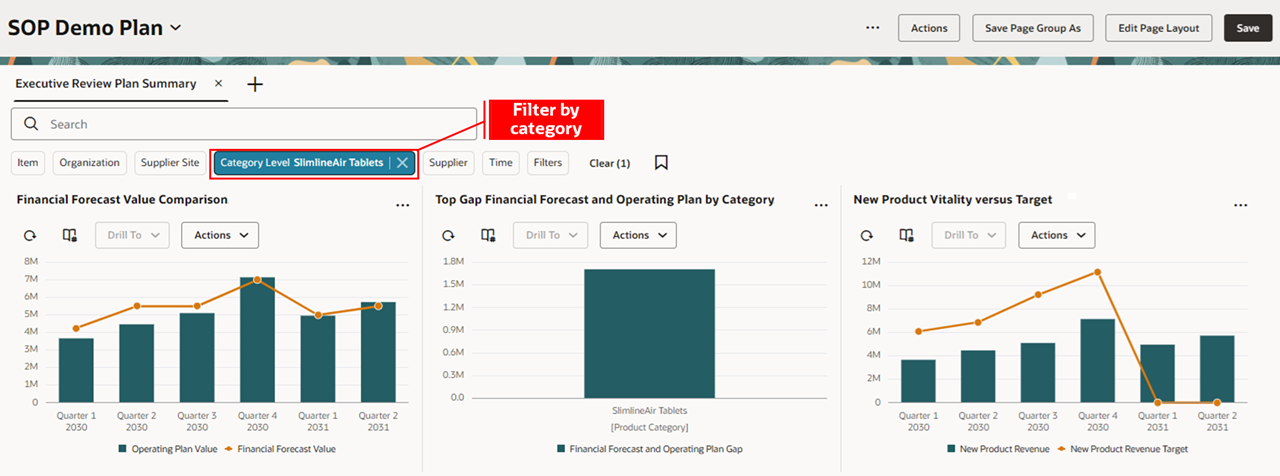
Category Level Filter
You can drill to visualizations within the page.
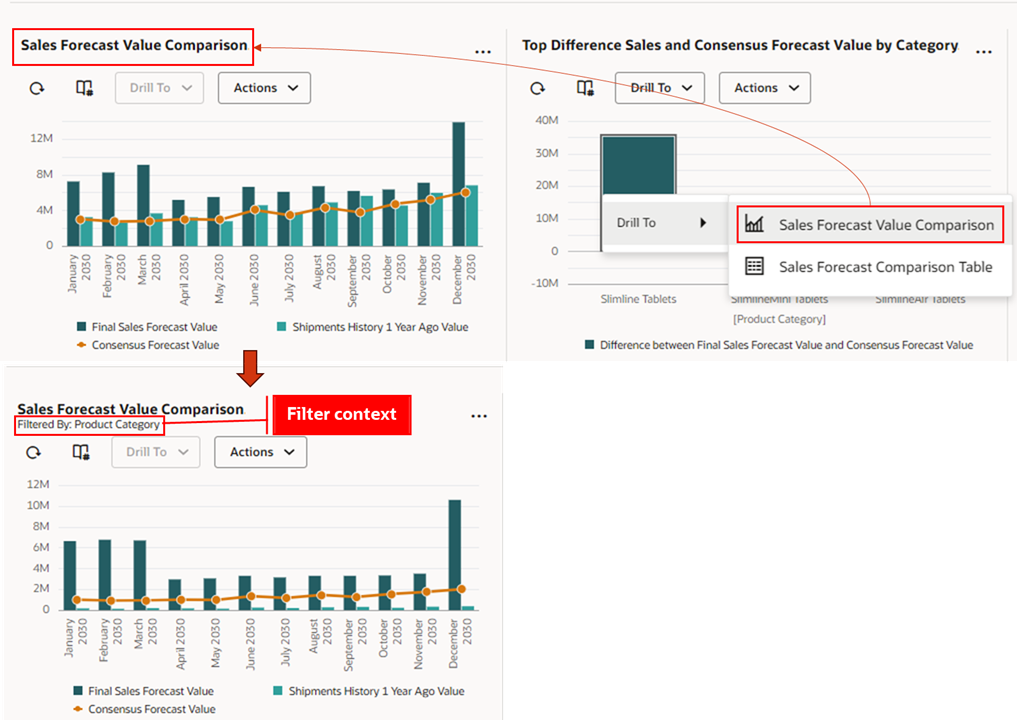
Drill To Visualization by Category Level Within the Page
You can also drill to visualizations outside of the current page. If the drill to report isn’t within the current page, it opens in a temporary page.
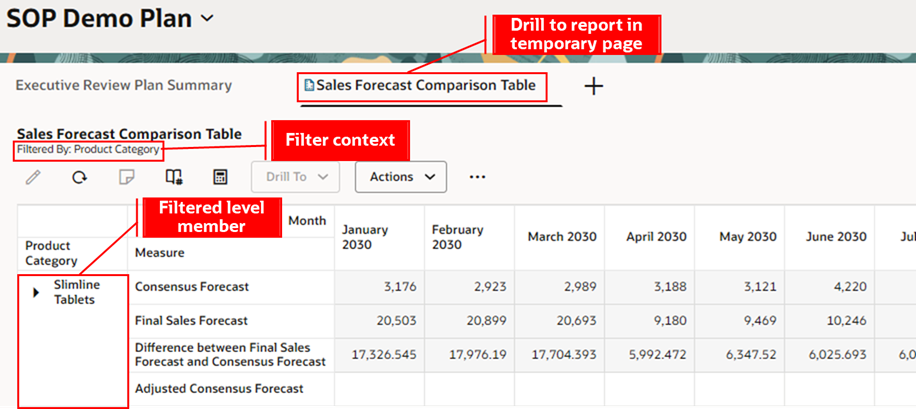
Drill To Visualization by Category Level Outside the Page
The Supply Chain Planning work area provides an actions menu for sales and operations planners to analyze plans. The available actions are determined by the user’s security privileges. Click Actions to open a drawer that contains the following actions:
- Plan Actions
- Approve Plan
- Archive Plan
- Close Plan
- Load Plan
- Reset Approval Status
These plan actions work the same way in the Sales and Operations Planning work area.
- Pages and visualizations
- Planning pages – This action navigates to a list of available pages and page groups.
- Planning visualizations - This action navigates to a list of available pivot table and graph visualizations.
- Plan Inputs
- Copy Data Between Measures
- Plan Inputs
- Planning Calendars
- Segment Groups and Criteria
- Supply Chain Planners
- Configuration
- Planning Cycles
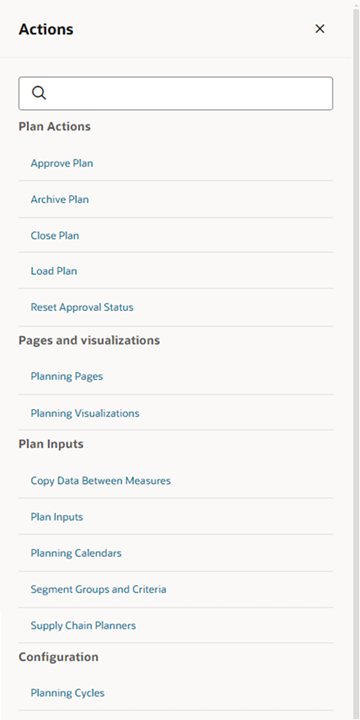
Actions Drawer
The most frequently used plan actions are available in the More Actions menu. These are:
- Run
- Duplicate Plan
- Compare Plans
- View Status Details
- Plans
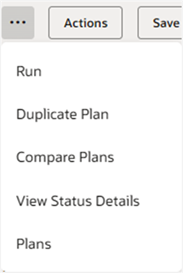
More Actions Menu
You can compare the current plan with up to three additional plans to visualize different scenarios and make planning decisions.
In compare mode, the graphs from the selected plans are shown in a single row for easy comparison.
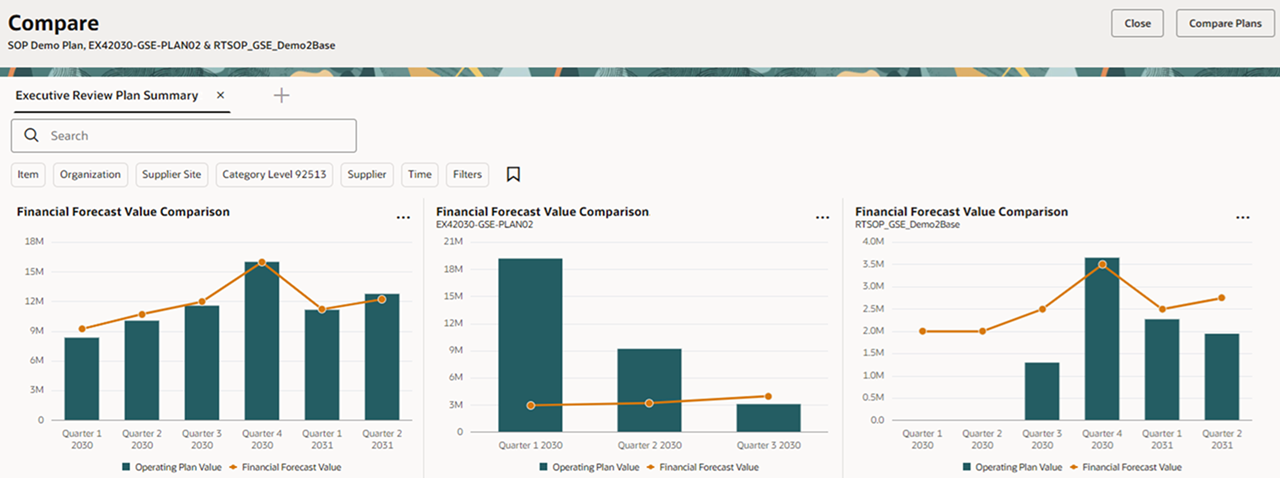
Plan Comparison with Graphs
The following actions aren’t allowed in the graph visualizations of a compared plan:
- Accessing the graph toolbar actions.
- Performing a drill to action on the graph.
- Accessing the graph actions menu to edit properties, manage links, or change the size.
Display of pivot tables in compare mode – The comparable measure values for the different plans are shown as separate rows in a single pivot table under the Scenario column header. The current plan is displayed as BasePlan.
The following actions aren’t allowed in compare mode in a pivot table:
- Editing measure data and notes in the table
- Changing or refreshing the layout of the table
- Changing visualization properties, including the size
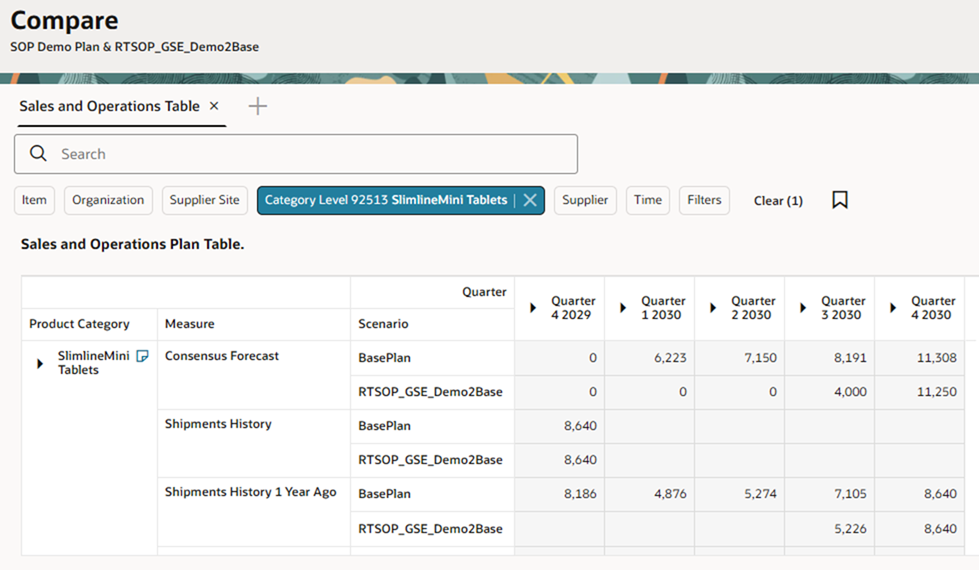
Plan Comparison in a Pivot Table
Plan comparison isn’t supported for standard tables such as Items.
Manage Visualizations - Pivot Tables and Graphs
- Visualization’s properties, including name, description, work area type, data, and layout can be defined using Edit Properties in each visualization's action menu on the right top hand corner of the visualization.
- Visualization properties include measures, hierarchies, member filters, and layout. The available measures and hierarchies depend on the current plan.
- The toolbar can be hidden using the Show/Hide control.
- You can link a table or graph to another table or graph, or a page by selecting Manage Links from the Actions menu on the toolbar. You can pass the context of a table or graph to another table, graph, or page using the links.
Refer to Redwood: Configure Pivot Tables and Graphs Using a New User Experience for more details.
Pages and Page Groups
Each page can contain multiple visualizations and can be organized into page groups tailored for specific types of analysis, such as adjusting demand forecasts or managing supply exceptions. You can switch between different page groups to efficiently complete tasks and streamline your analysis.
To create a new page:
- Click Page icon on the pages tab.
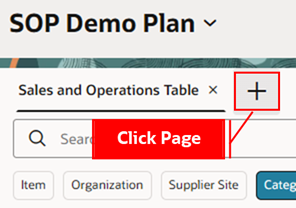
Page Action
- Click Create Page to create a new page and add it as a new tab.
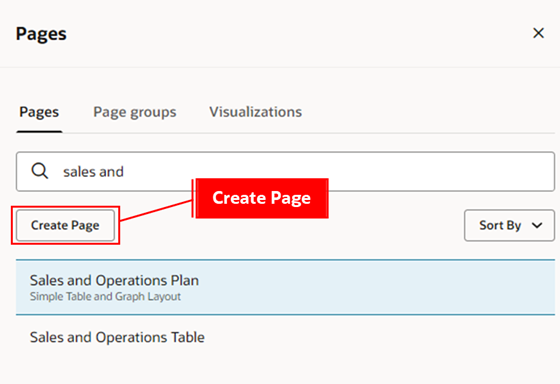
Pages Drawer
- Add visualizations from the content library to the page.
- Rearrange the visualizations on the page by moving them to your desired position.
You can modify the content of a page group by performing the following actions:
- Select a page group from the list.
- Drag pages to rearrange their order in the page group.
- Click Save Page Group As to save the page group.
Each user can set a personalized default page group.
Refer to Redwood: Manage Pages and Page Groups Using a New User Experience for more details.
Edit Page Layout
You can edit a page using Edit Page Layout:
- Edit Page Layout changes the page from Default mode to Edit mode.
- In Edit mode, you can add tables and graphs into your page layout from the content library. You can perform the following changes to the page layout:
- Add a visualization, with up to four visualizations per row and as many rows as needed.
Example of visualizations arranged in two rows – first row has four visualizations, and second row has one.
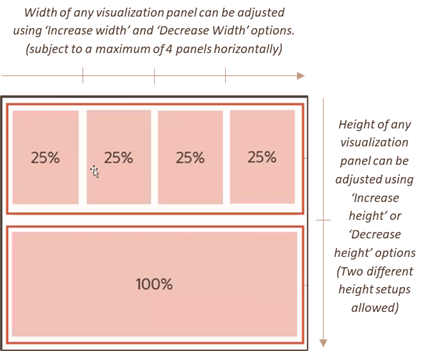
Page Layout
Changing Visualization Layout Properties
You can change the visualization size by using the change width and change height options in the visualization’s properties menu.
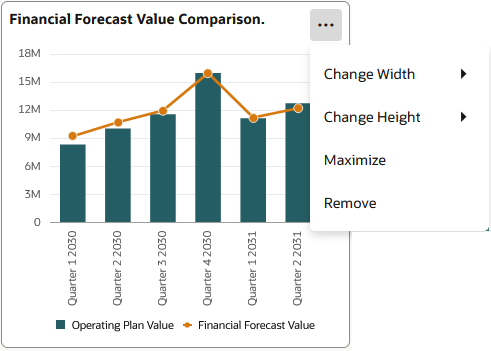
Adjust Page Size
- Size and appearance of visualizations: Visualizations can be arranged in columns and rows as follows:
- The default height is one unit, approximately 50% of the available display height. You can increase height to two units if needed, which will be double the default.
- Each visualization can be maximized to occupy the full width and height of the display, depending on the client.
- Search and add visualizations: You can add any type of visualization, such as pivot table, graph, or other standard table, to the page using one of the following actions.
- Drag and drop the visualization to a specific place in the page.
- Use the + sign, which adds the visualization to the bottom of the page.
- Remove a visualization: You can remove a visualization by:
- Dragging it back to the content library.
- Clicking Remove on the visualization properties menu in edit layout.
- Rearrange visualizations: Rearrange the visualizations on a page by dragging and dropping them either between two visualizations or on top of another visualization. In the latter case, the page automatically adjusts the layout by swapping the visualizations.
Here's the demo of these capabilities:
Steps to Enable
Follow these steps to enable or disable the Redwood: Analyze Sales and Operations Planning Plans Using a Configurable Redwood Page feature:
- In the Setup and Maintenance work area, search for and select the Manage Administrator Profile Values task.
- On the Manage Administrator Profile Values page, search for and select the ORA_MSC_SALES_AND_OPERATIONS_PLANNING_REDWOOD_ENABLED profile option code.
- In the Profile Values section, set the Site Level to Yes or No. The default value is No.
- Yes = enables the feature
- No = disables the feature
- Click Save and Close. Changes in the profile value will affect users the next time they sign in.
Tips And Considerations
- Visualizations Limit - For performance reasons, the maximum number of visualizations allowed in a user session is controlled by the following profile option:
- Maximum Number of Visualizations on a Supply Chain Planning Page Group (ORA_MSC_REDWOOD_MAX_VISUALISATIONS)
- This is the maximum number of visualizations across all pages in the current session. The default maximum number of visualizations is twenty. However, most pivot tables and large graphs consume more memory than simple graphs. It’s recommended to keep the number of visualizations in a single page group under ten for a better user experience.
- If a user doesn’t have any accessible plans, or if the planning environment is undergoing maintenance, no content is visible. The Actions menu and planning tasks are still available.
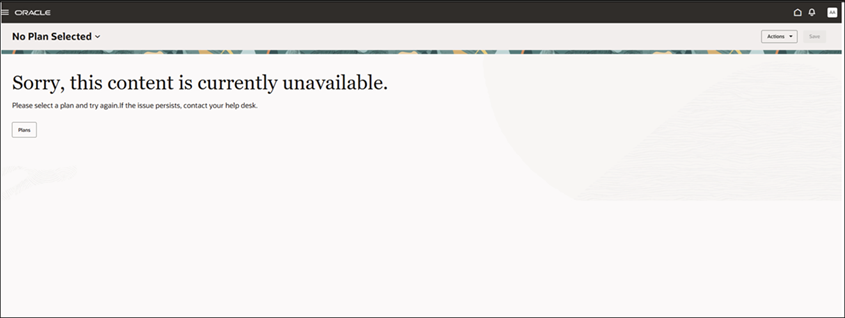
No Available Plans Message
- The actions and menu layout in the page toolbar will be modified in coming updates.
Key Resources
- Refer to the Cloud Applications Readiness content for the following 25B Supply Chain Planning features for more information on the Supply Chain Planning Work Area:
- Redwood: Access Supply Chain Planning Work Area Using a New User Experience
- Redwood: Use Pivot Tables to Analyze Plans Using a New User Experience
- Redwood: Use Graphs to Analyze Plans Using a New User Experience
- Redwood: Configure Pivot Tables and Graphs Using a New User Experience
- Redwood: Manage Planning Notes Using a New User Experience
- Redwood: Manage Visualizations Using a New User Experience
- Redwood: Manage Pages and Page Groups Using a New User Experience
Access Requirements
Users who are assigned a configured job role that contains these privileges can access this feature:
- Monitor Sales and Operations Planning Work Area (MSC_MONITOR_SALES_AND_OPERATIONS_PLANNING_WORK_AREA_PRIV)
- View Planning Objects Using REST Service (MSC_VIEW_PLANNING_OBJECTS_REST_SERVICE_PRIV)
These privileges were available prior to this update.