Extend the Activities Dashboard with OTBI KPIs and Visualizations
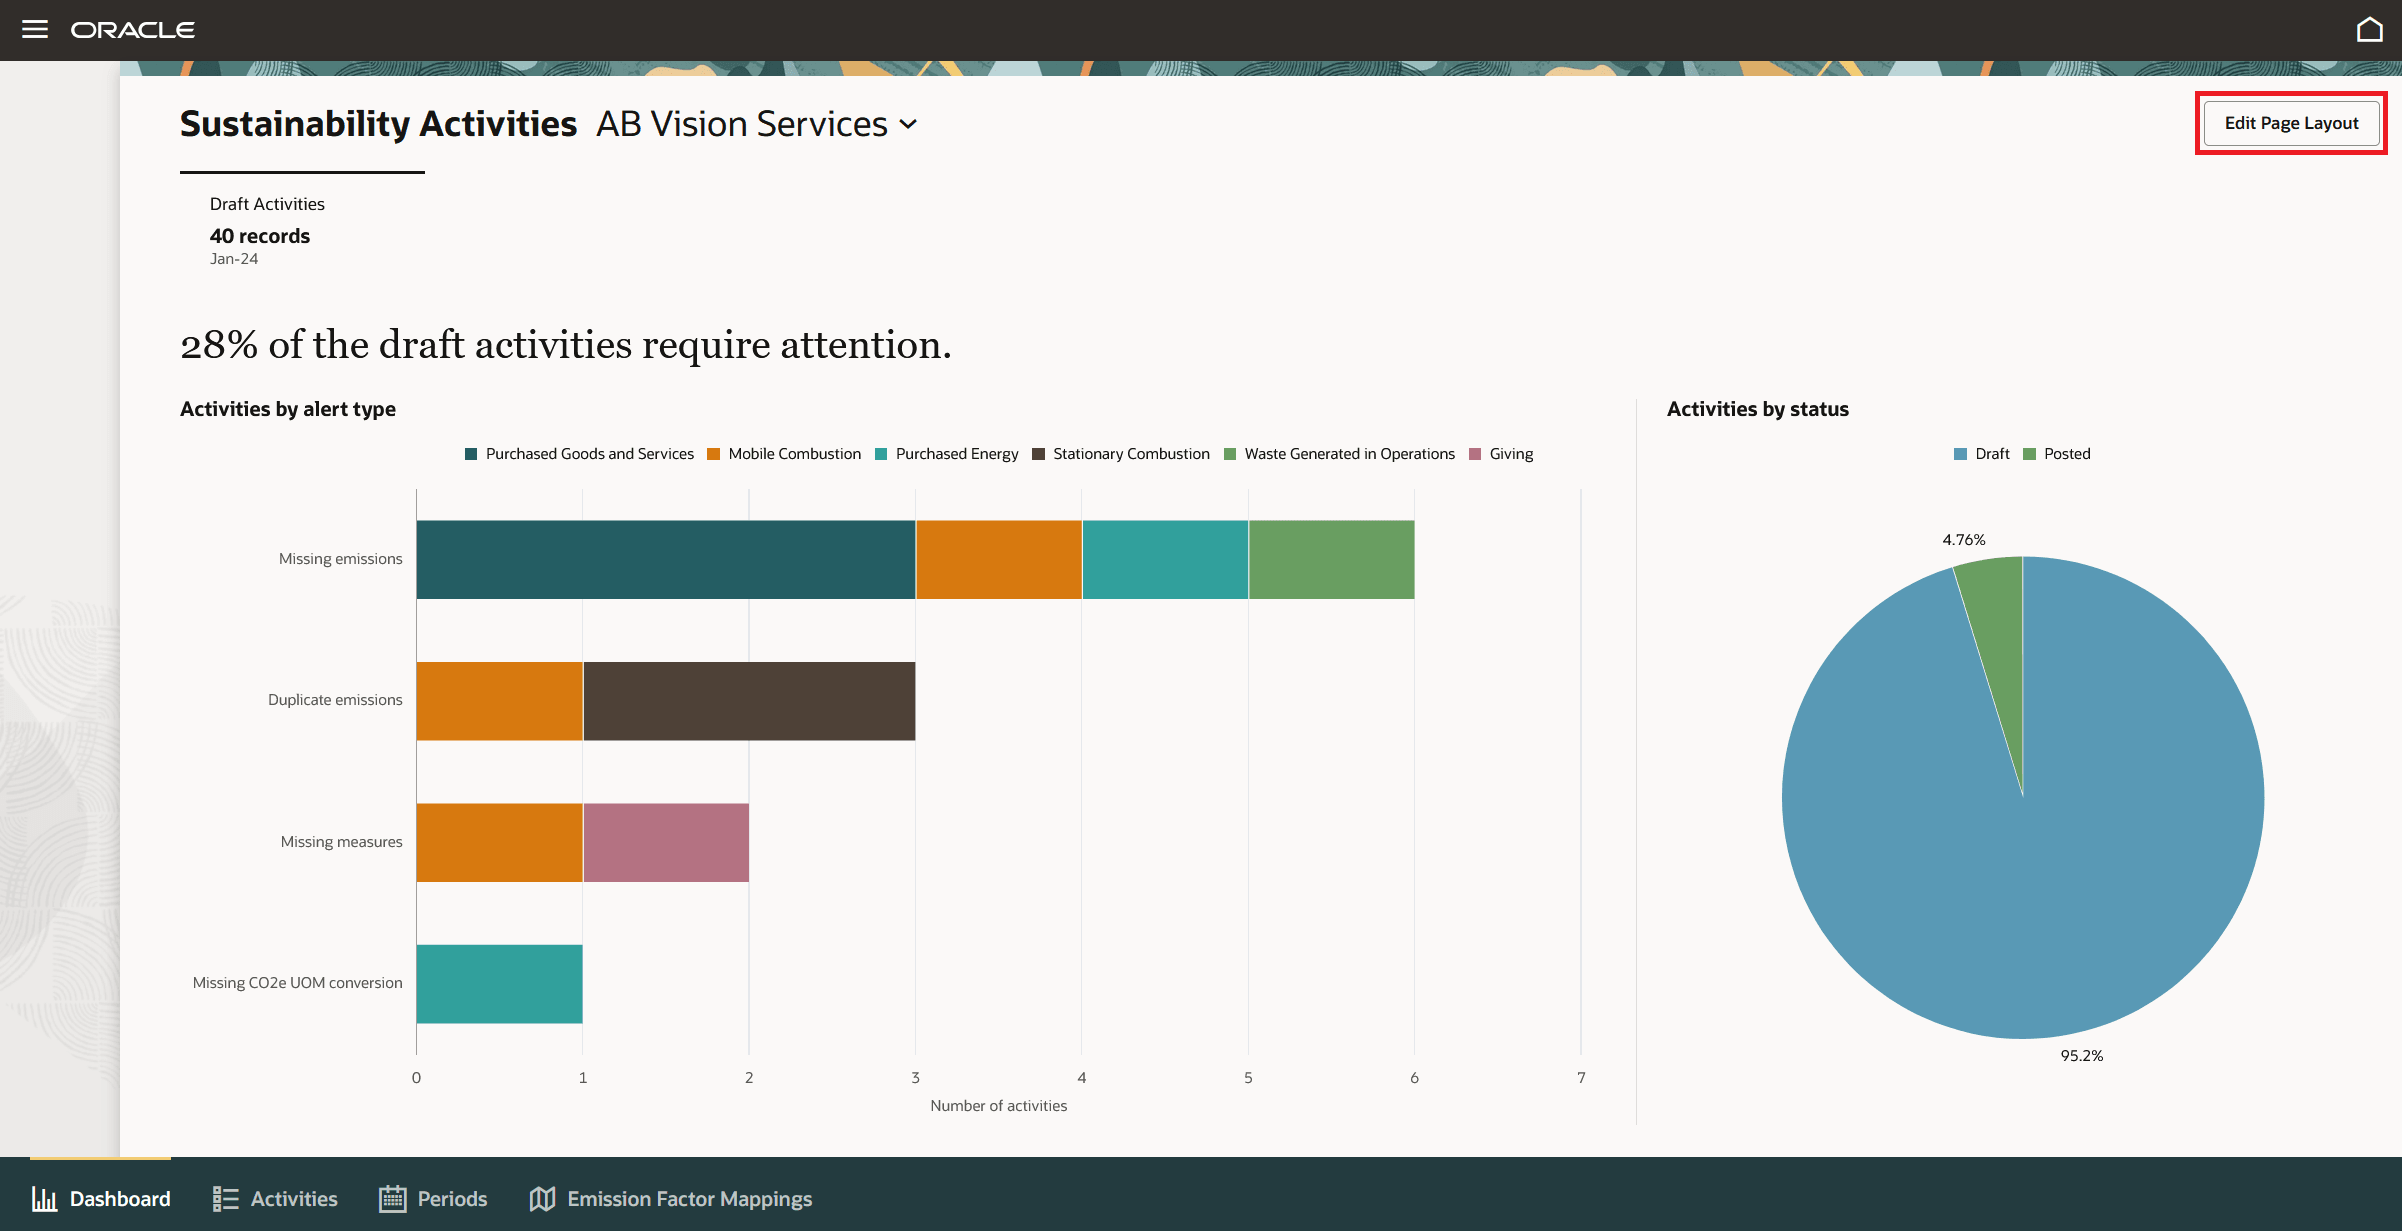
The sustainability administrator can now create scorecards by adding Oracle Transactional Business Intelligence (OTBI) KPIs and data visualizations on the Sustainability Activities dashboard by using the Edit Page Layout button.

Sustainability Activities Dashboard with Edit Page Layout Button
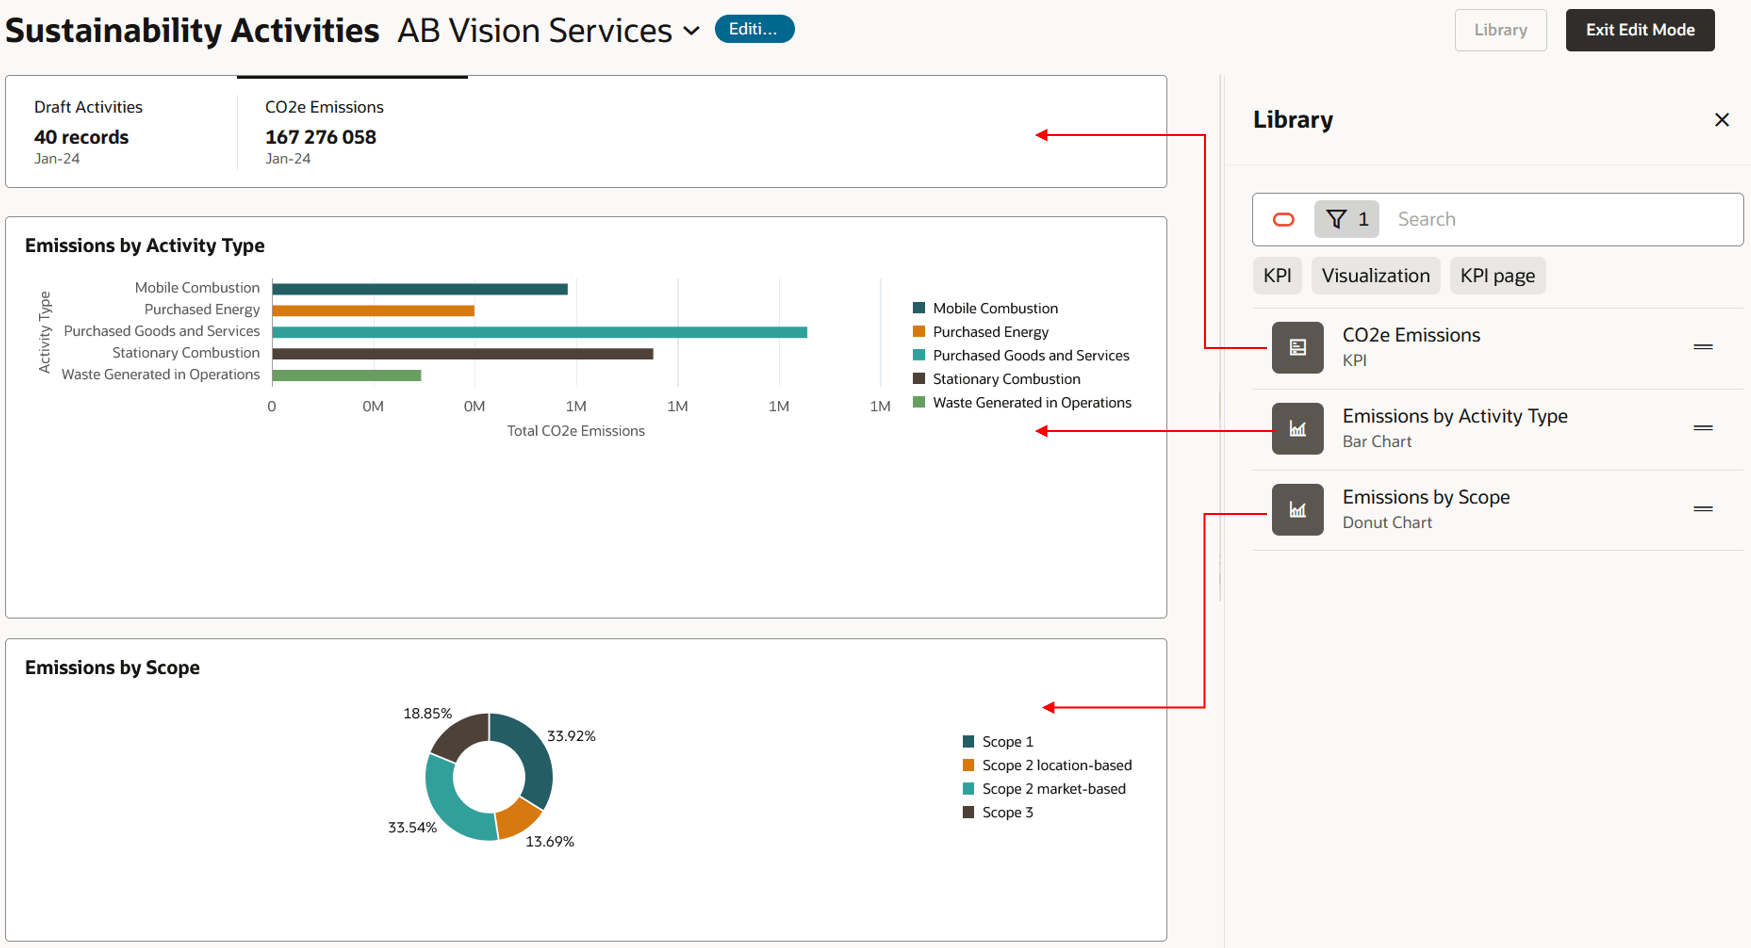
To add an OTBI-based KPI and its associated visualization, click Edit Page Layout. From the library, drag the KPI content to the scoreboard region which adds an additional tab. Then, drag the corresponding visualizations to the area below the scoreboard. Click Exit Edit Mode.

Add OTBI-Based KPIs and Visualization to the Sustainability Dashboard Page
Creating KPIs and Visualizations to Add to the Sustainability Dashboard Page
To make the KPIs and visualizations appear as eligible options on the dashboard page, you must first add them to the Visualization Configurations page.
You can access the Visualization Configurations page by using the following URL:
https://<YOUR_FUSION_INSTANCE>/fscmUI/redwood/cx-analytics/application/container/dvconfig
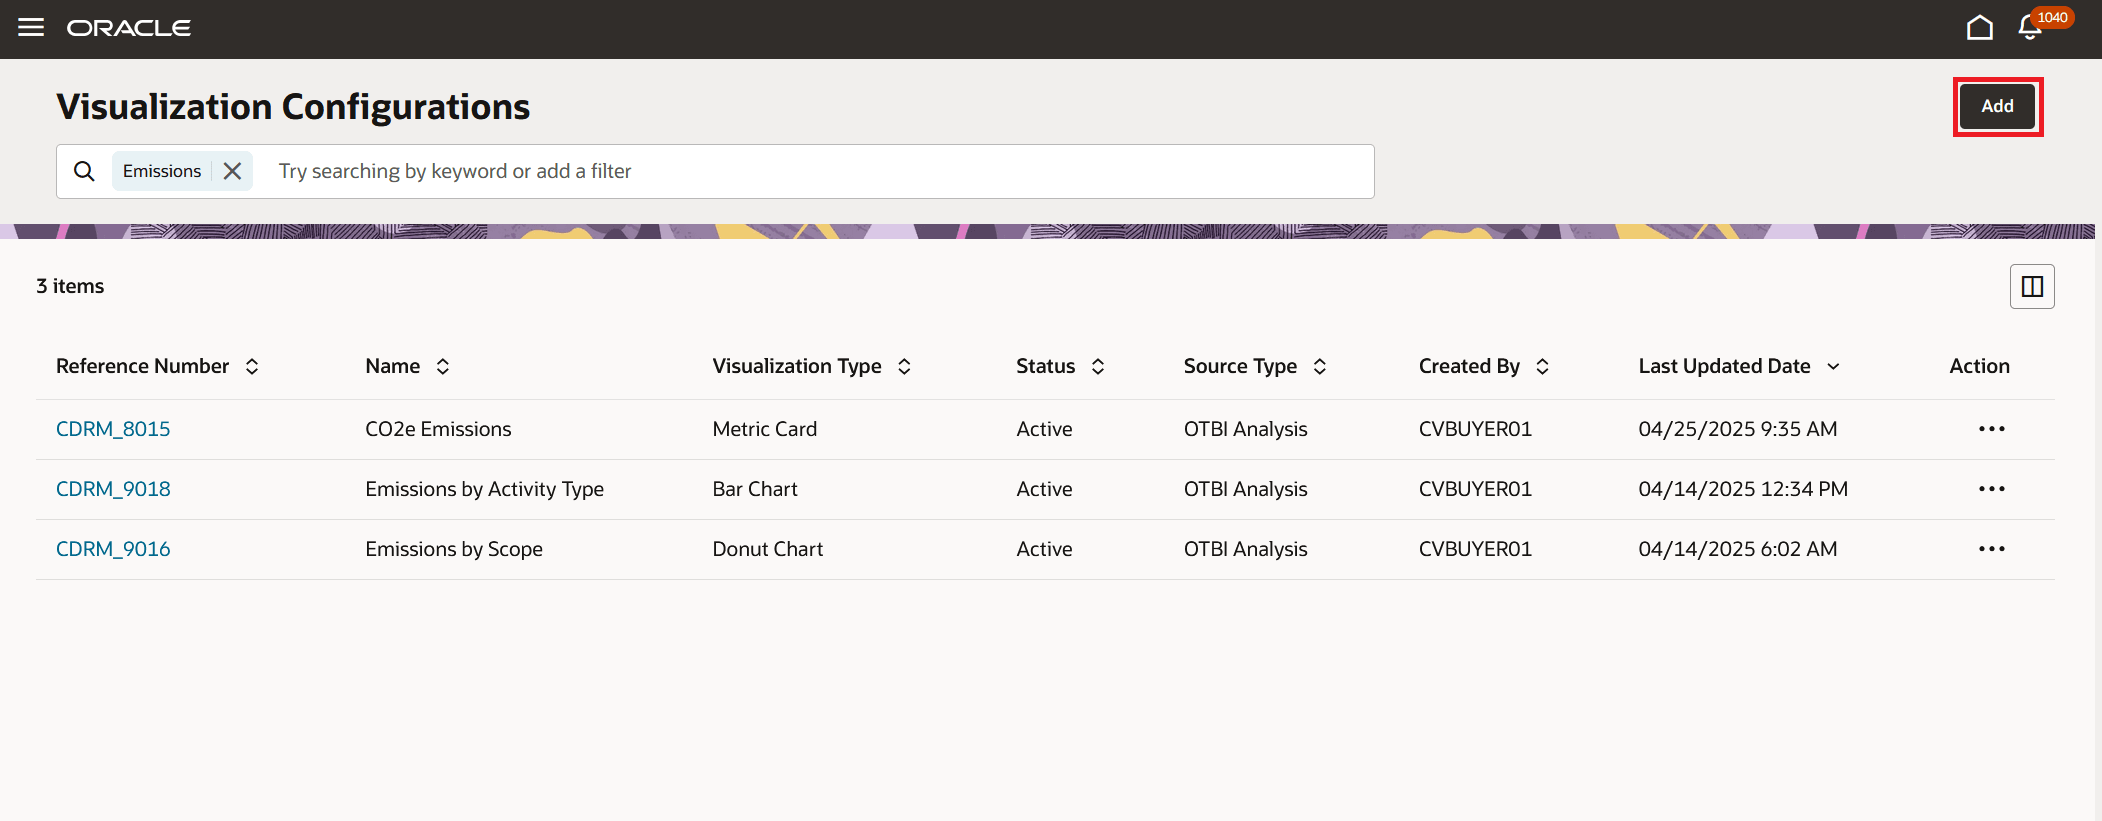
1. On the Visualization Configurations page, click Add.

Visualization Configurations Page
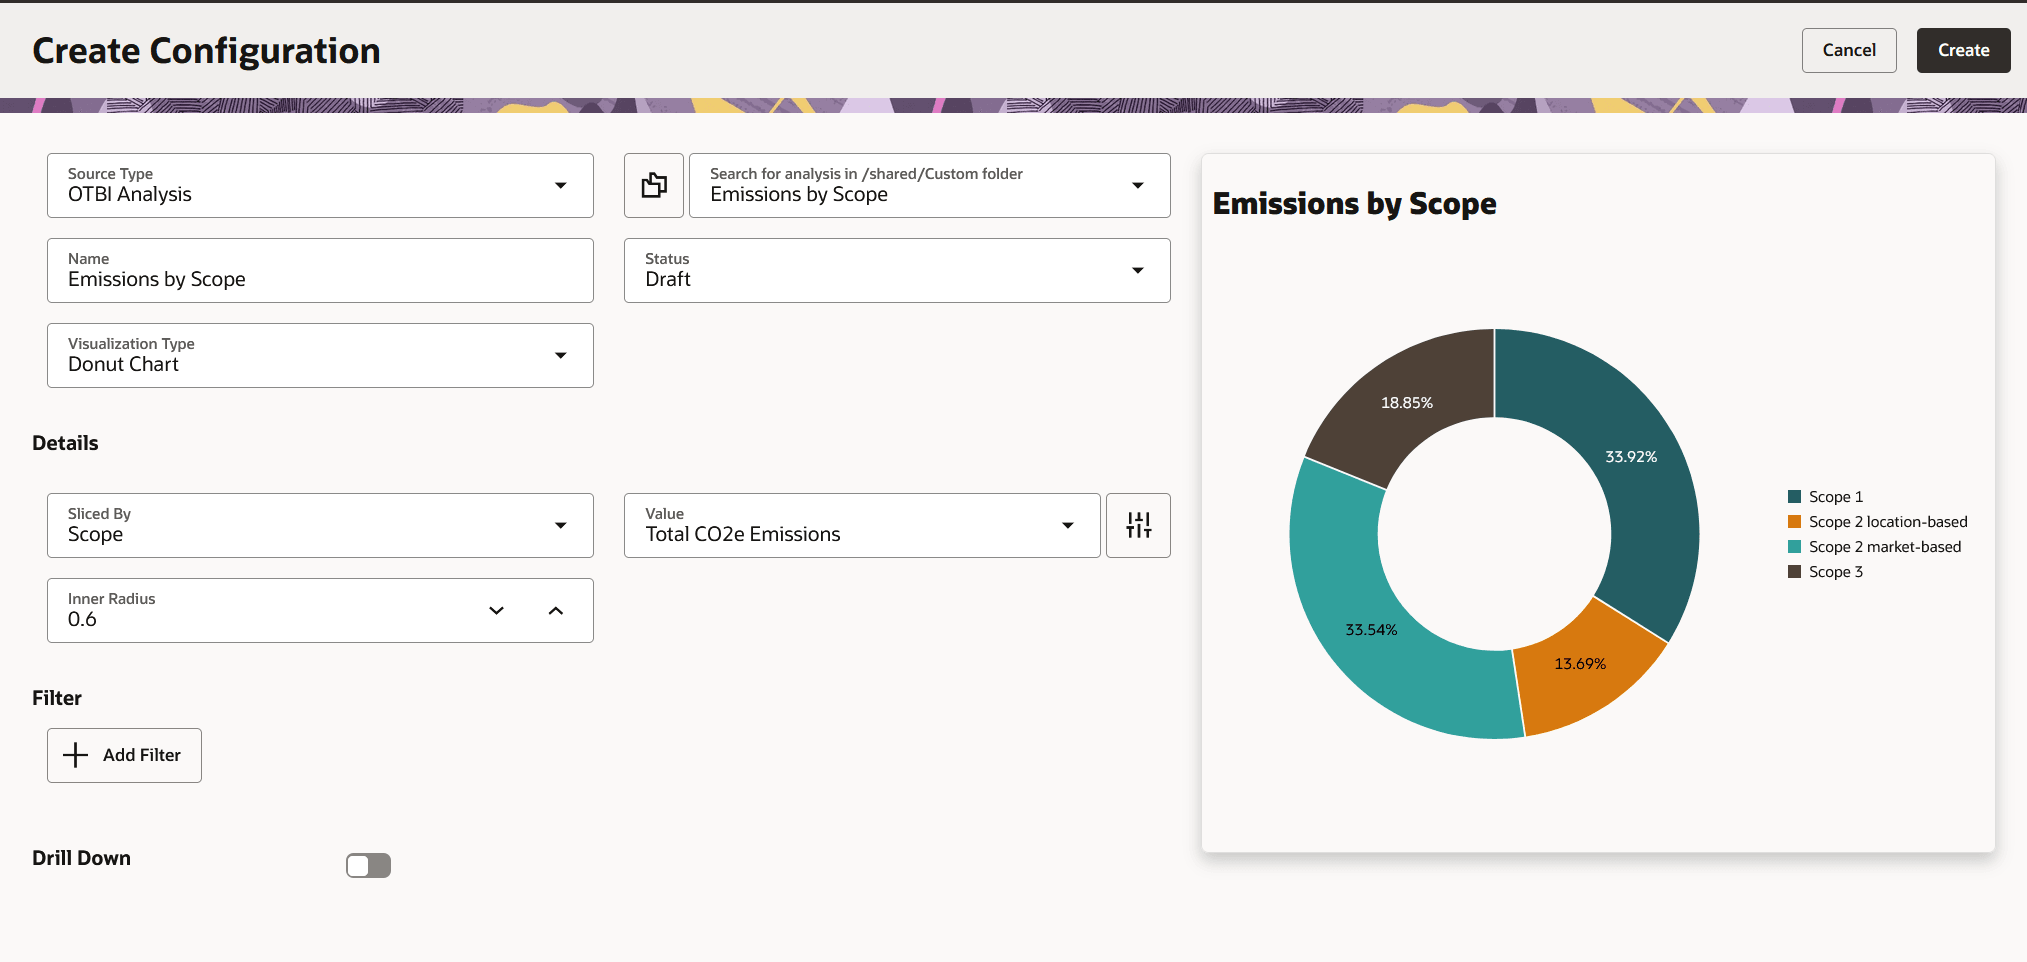
2. On the Create Configuration page, specify values for the relevant fields and then click Create.

Configure OTBI KPIs and Data Visualizations
You can enhance your dashboard by including KPIs and data visualizations that best represent your business and are critical for your users to see.
Steps to Enable
You don't need to do anything to enable this feature.
Tips And Considerations
- You can add KPIs and visualizations based on your OTBI analytics and reports.
- You can't remove the predefined scorecard using the Edit Page Layout button.
- When adding KPIs and data visualizations to the Visualization Configurations page, ensure that the KPIs have the Visualization Type set to Metric Card.
Key Resources
- For additional details about how to add your own key performance indicators (KPIs) and visualizations to your page, see: Flexible Reporting in Redwood Dashboards.
- Additional resources:
- Oracle Fusion Cloud HCM and SCM: Extending Redwood Applications for HCM and SCM Using Visual Builder Studio, available on the Oracle Help Center.
Access Requirements
Users who are assigned a configured job role that has all the privileges of the predefined Sustainability Application Administrator role and the following privileges can add KPIs and Visualizations to the Sustainability Activities Dashboard:
- Edit Page Layout of the Sustainability Activities Dashboard Page (SUS_EDIT_SUSTAINABILITY_ACTIVITIES_DASHBOARD_PAGE_LAYOUT_PRIV)
- Manage System Searches (HRC_MANAGE_SYSTEM_SEARCHES_PRIV)
Users who are assigned a configured job role that has all the privileges of the predefined Sustainability Application Administrator role and the following privileges can create OTBI-based KPIs and visualizations on the Visualization Configurations page for use on the Sustainability Activities Dashboard:
- View Data Visualization Configuration (ZCA_VIEW_DATA_VISUALIZATION_CONFIGURATION_PRIV)
- Manage Data Visualization Configuration (ZCA_MANAGE_DATA_VISUALIZATION_CONFIGURATION_PRIV)
- View Trading Community Resource Details (HZ_VIEW_TRADING_COMMUNITY_RESOURCE_DETAILS_PRIV)