Monitor and Visualize Warehouse Capacity Utilization
In a distribution intensive environment, you may want to analyze the plan to monitor the anticipated usage of storage capacity against the available storage capacity at the distribution warehouses or manufacturing plants. This update includes predefined capabilities for this analysis. A new measure, Required Capacity, enables you to analyze the required capacity, which is calculated by the system and uses the volume attributes associated with an item and the planned order quantities. The available capacity is a user-editable measure that you can upload using file-based data import (FBDI) templates. You can also consider nuances in the types of storage capacity, such as refrigerated storage.
This feature allows you to:
- Specify the volume unit of measure (UOM) of a warehouse.
- Collect warehouse availability capacity.
- Compute warehouse required capacity.
- Review warehouse capacity utilization.
It applies to supply plans and replenishment plans.
You can also monitor and visualize warehouse capacity for a subinventory modeled as an organization in a replenishment plan.
You can also collect warehouse available capacity for a storage category and review warehouse capacity utilization at the storage category level.
New Measures
The following are the new measures associated with this feature.
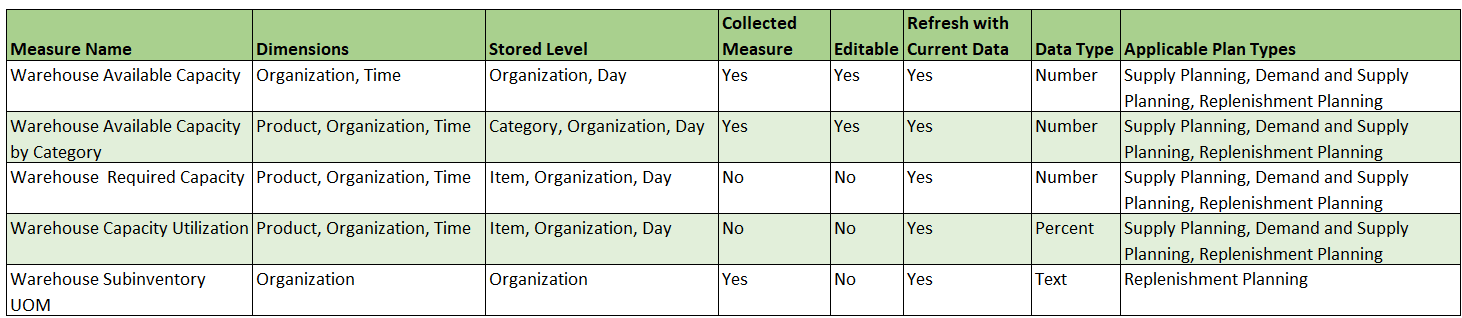
Warehouse Capacity Utilization Measures
- Warehouse Required Capacity is computed by the plan.
- Warehouse Capacity Utilization is an expression-based measure and is the ratio of Warehouse Required Capacity to Warehouse Available Capacity.
- Warehouse Subinventory UOM provides the UOM code of a subinventory that’s considered as an organization in subinventory-level planning in a replenishment plan.
Monitor and Visualize Warehouse Capacity Utilization
To monitor and visualize warehouse capacity utilization:
- Define the volume UOM for the organization on the Maintain Supply Network Model page in Plan Inputs. For replenishment plans, collect Warehouse Subinventory UOM if the subinventory modeled as an organization has a different UOM code than the organization UOM specified on the Maintain Supply Network Model page.
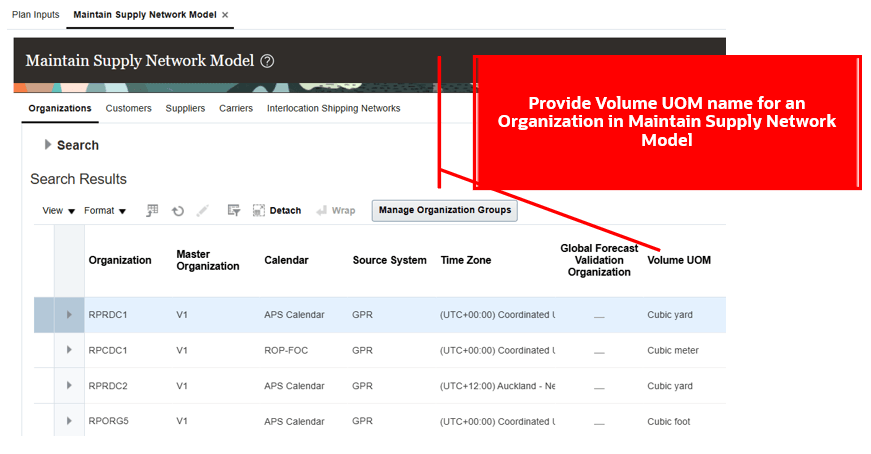
Volume UOM Defined for Organization
- Prepare and collect available capacity for a warehouse in the Warehouse Available Capacity measure using the ScpMeasuresImport FBDI template.
- Add the measures Warehouse Available Capacity, Warehouse Required Capacity, and Warehouse Capacity Utilization to the plan’s measure catalog.
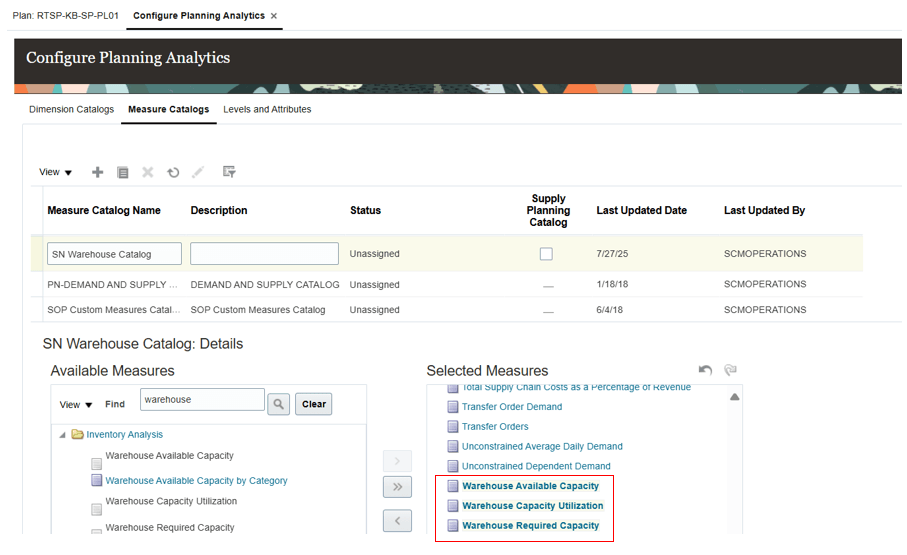
Plan’s Measure Catalog with Warehouse Capacity Visualization Measures
- Run the supply plan or replenishment plan with a complete refresh.
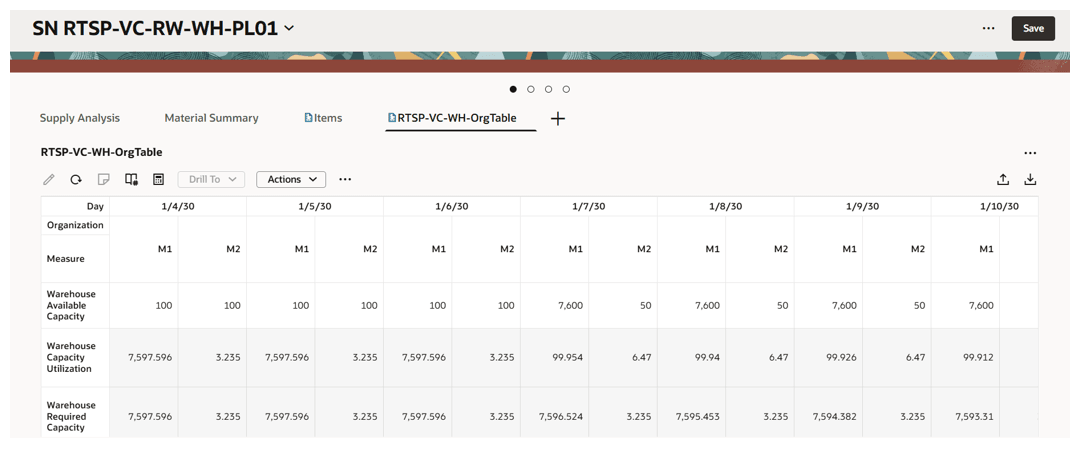
- Create a pivot table with the measures Warehouse Available Capacity, Warehouse Required Capacity, and Warehouse Capacity Utilization and include the Organization and Time dimension hierarchies.
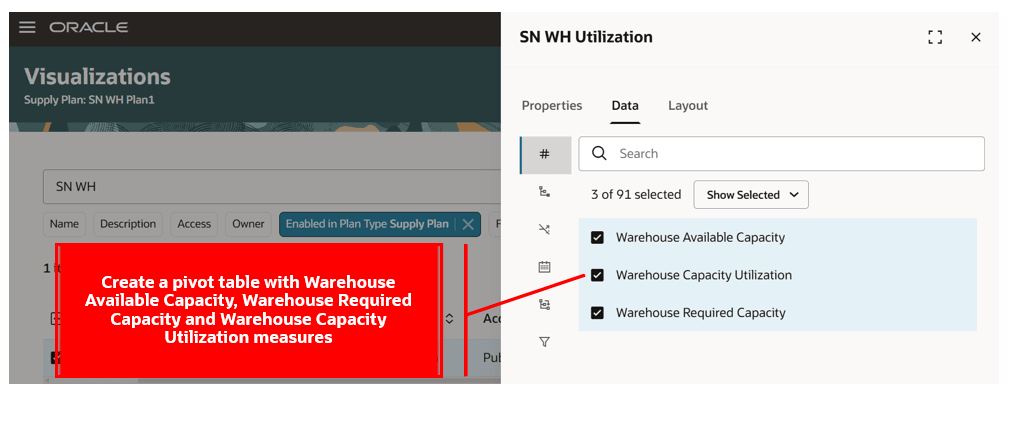
Pivot Table Created with Warehouse Capacity Visualization Measures
- Review and analyze to monitor and visualize warehouse capacity utilization.
The plan computes Warehouse Required Capacity as follows:
- Warehouse Required Capacity of an item in an organization in a time bucket = (projected available balance of the item in the organization in a time bucket) x (unit volume of the item in the organization) x (conversion factor between the volume UOM of the item and organization volume UOM from Supply Network Model).
- The measure value for Warehouse Required Capacity is expected to be interpreted in the organization UOM specified in the Supply Network Model.
- For example, the projected available balance of an item is 3,000 in a time bucket, and the unit volume of the item is 2 cubic centimeters. The organization volume UOM is cubic foot, and the conversion between cubic centimeter to cubic foot is 0.000035. Then the Warehouse Required Capacity measure value for the item in the organization is 3,000 x 2 x 0.000035 = 2.1 cubic feet.
For replenishment plans enabled at subinventory level planning, the planning process derives the Organization volume as follows.
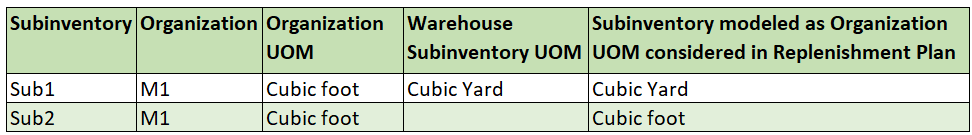
Subinventory Unit of Measure Consideration Logic by Replenishment Plan
Example of Visualizing Warehouse Capacity Utilization in a Supply Plan
Let’s consider a supply plan where the plan has computed Warehouse Required Capacity for the items in organization M1. In this example, we can see that the plan has computed Warehouse Required Capacity for item VC-ENG-Mouse in organization M1 based on the projected available balance measure value of the item, the item’s unit volume, and applying the standard conversion between the item’s volume UOM – cubic centimeter – and the organization UOM – cubic foot.
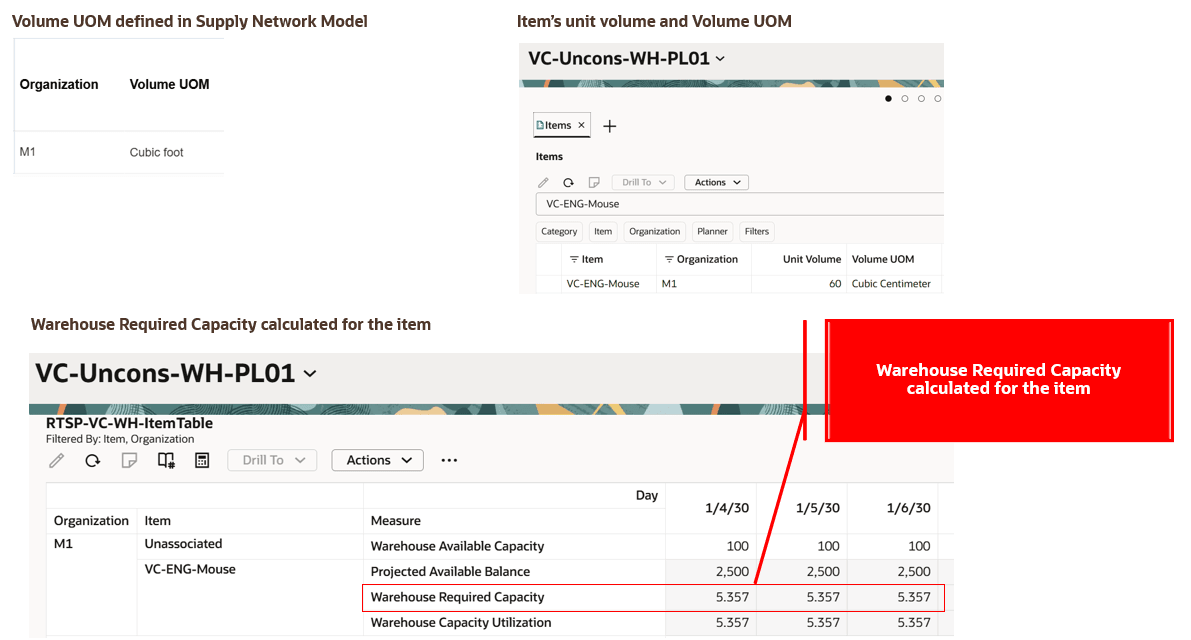
Warehouse Required Capacity Computed by Supply Plan
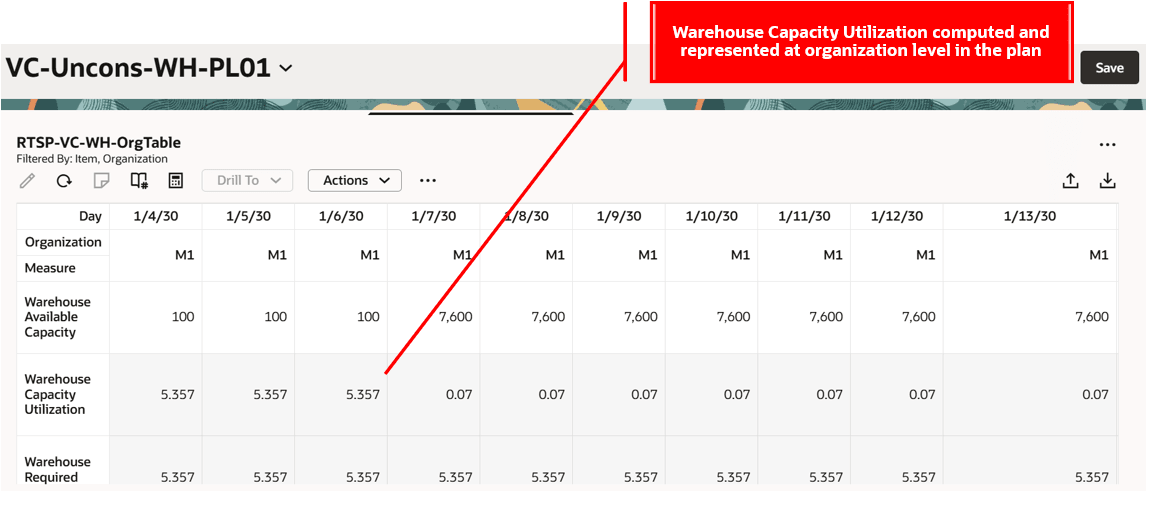
Warehouse Capacity Visualization at Organization Level Filtered by Item
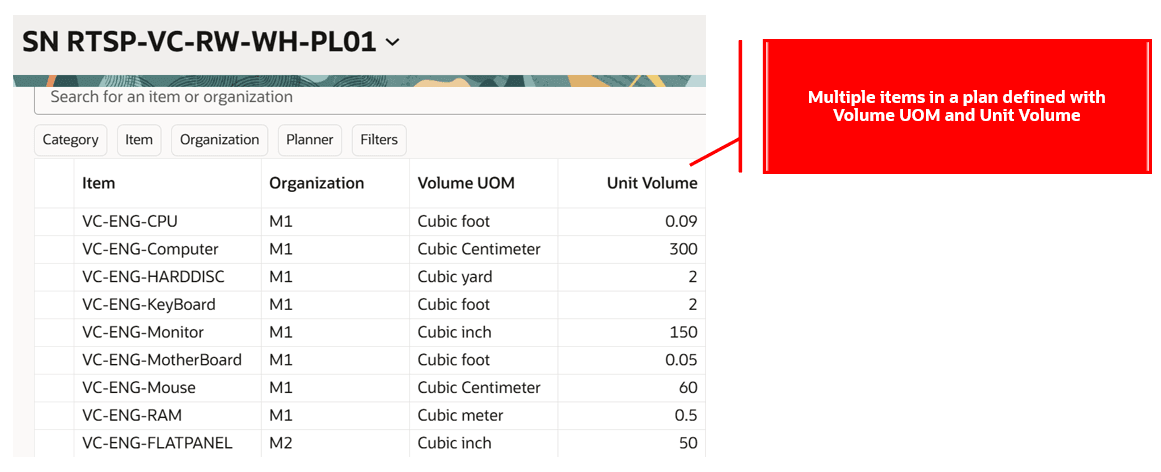
Items with Volume UOM and Unit Volume
Warehouse Capacity Utilization at Organization Level
Monitor and Visualize Warehouse Capacity Utilization at Storage Category Level for Items
To monitor and visualize warehouse capacity utilization at the storage category level for items:
- Categorize the items in the plan scope based on storage category, for example, dry storage or cold storage.
- You can create a catalog and categories as storage categories in Oracle SCM Cloud and assign to items. Or you can create a user-defined product catalog with categories representing storage categories for items by using the ScpUser-DefinedHierarchyImport FBDI template.
- Prepare and collect storage-category-specific available capacity using the Warehouse Available Capacity by Category measure.
- Create a duplicate of the Warehouse Capacity Utilization measure with the expression Warehouse Required Capacity / Warehouse Available Capacity by Category, with data type as Number.
- Optionally, if you want to visualize storage-category specific UOM warehouse capacity utilization, you can also select the storage-category UOM as the display UOM in the measure configuration in Manage Planning Measures for Warehouse Required Capacity and in the duplicated measure of Warehouse Capacity Utilization.
- Add the Warehouse Available Capacity by Category and Warehouse Required Capacity measures and the duplicate Warehouse Capacity Utilization measure to the plan's measure catalog.
- Run the supply plan or replenishment plan with a complete refresh.
- Create a pivot table with the Warehouse Available Capacity by Category and Warehouse Required Capacity measures and the duplicate Warehouse Capacity Utilization measure and include the Organization and Time dimension hierarchies filtered by category.
- Select the display UOM in format measures in the pivot table configuration for the Warehouse Required Capacity measure and the duplicated measure of Warehouse Capacity Utilization to visualize warehouse capacity utilization based on a storage-category-specific display UOM.
Example of Visualizing Warehouse Capacity Utilization by Storage Category
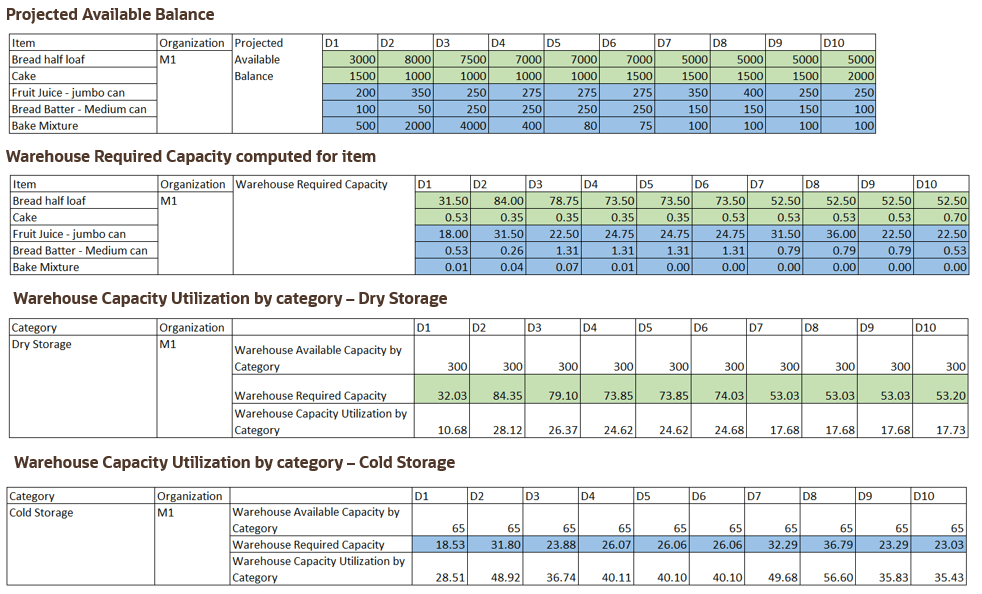
In this example we show the visualization of warehouse capacity utilization by the storage categories dry storage and cold storage.
Warehouse Capacity Utilization by Category measure value = (Warehouse Required Capacity/Warehouse Available Capacity by Category) x 100
In the following images, the pivot table Warehouse Capacity Utilization by Category – Dry Storage helps you visualize the warehouse capacity utilization for the items that are classified as dry storage, such as bread half loaf and cake. In a similar way, the pivot table Warehouse Capacity Utilization by Category – Cold Storage helps you visualize the warehouse capacity utilization for the items that are classified as cold storage, such as fruit juice, bread batter, and bake mixture. The Item Details table indicates which items are categorized as dry versus cold storage.
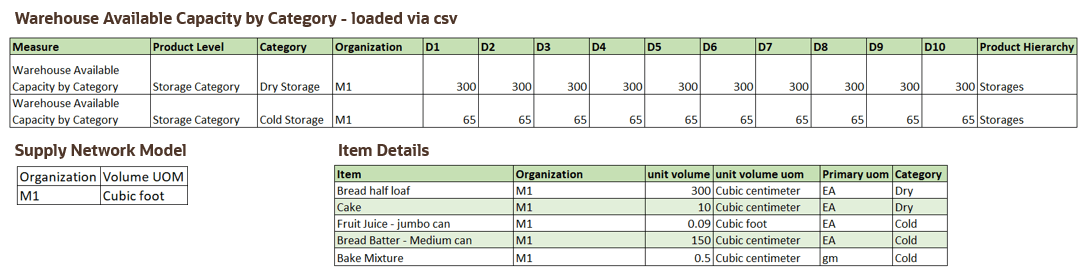
Item Details and Warehouse Available Capacity by Category
Warehouse Capacity Visualization by Storage Category of Item
Steps to Enable and Configure
You don't need to do anything to enable this feature.
Tips And Considerations
- You must define item-level interclass UOM conversions to ensure that the planning process applies the necessary conversions to compute warehouse required capacity and utilization.
- You can edit the Warehouse Available Capacity measure in plan output and review the warehouse capacity utilization measure details.
- The Warehouse Available Capacity by Category measure always refers to the default catalog in planning. If you’re using any catalog other than the default planning catalog, then you must create user-defined measures for available capacity and collect data. You must also create the corresponding warehouse capacity utilization by category measures using user-defined measures created with catalogs other than the default product catalog.
- Warehouse Available Capacity, Warehouse Available Capacity by Category, Warehouse Required Capacity, Warehouse Capacity Utilization, and Warehouse Subinventory UOM aren’t available in the default measure catalogs of Oracle Supply Planning and Oracle Replenishment Planning.
Access Requirements
Users who are assigned a configured job role that contains these privileges can access this feature:
- Monitor Supply Planning Work Area (MSC_MONITOR_SUPPLY_PLANNING_WORK_AREA_PRIV)
- Monitor Demand and Supply Planning Work Area (MSC_MONITOR_DEMAND_AND_SUPPLY_PLANNING_WORK_AREA_PRIV)
- Manage Replenishment Planning (MSC_MONITOR_REPLENISHMENT_PLANNING_WORK_AREA_PRIV)
These privileges were available prior to this update.