Redwood: Use Additional Capabilities to Analyze Build Plan
Supply chains can be complex, with multiple layers of distribution, manufacturing, and suppliers in the mix. The build plan facilitates end-to-end analysis of supply and demand across the supply plan. This update includes additional build plan capabilities, such as the ability to format the display measures.
If you haven’t already, please review the documents listed in the Key Resources section for an overall explanation of how the Redwood version of build plan works. In this update we’ll specifically focus on the capabilities delivered in 25D that continue to enhance the Redwood build plan user experience
You can now apply conditional formatting to cells within the build plan by clicking on the Format Measures icon in the toolbar.
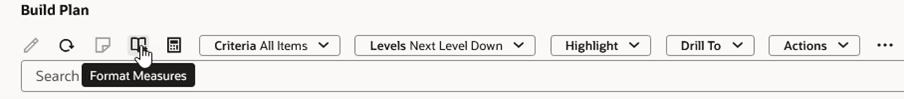
Build Plan Toolbar Showing the Format Measures Icon
This opens the Format measures drawer.
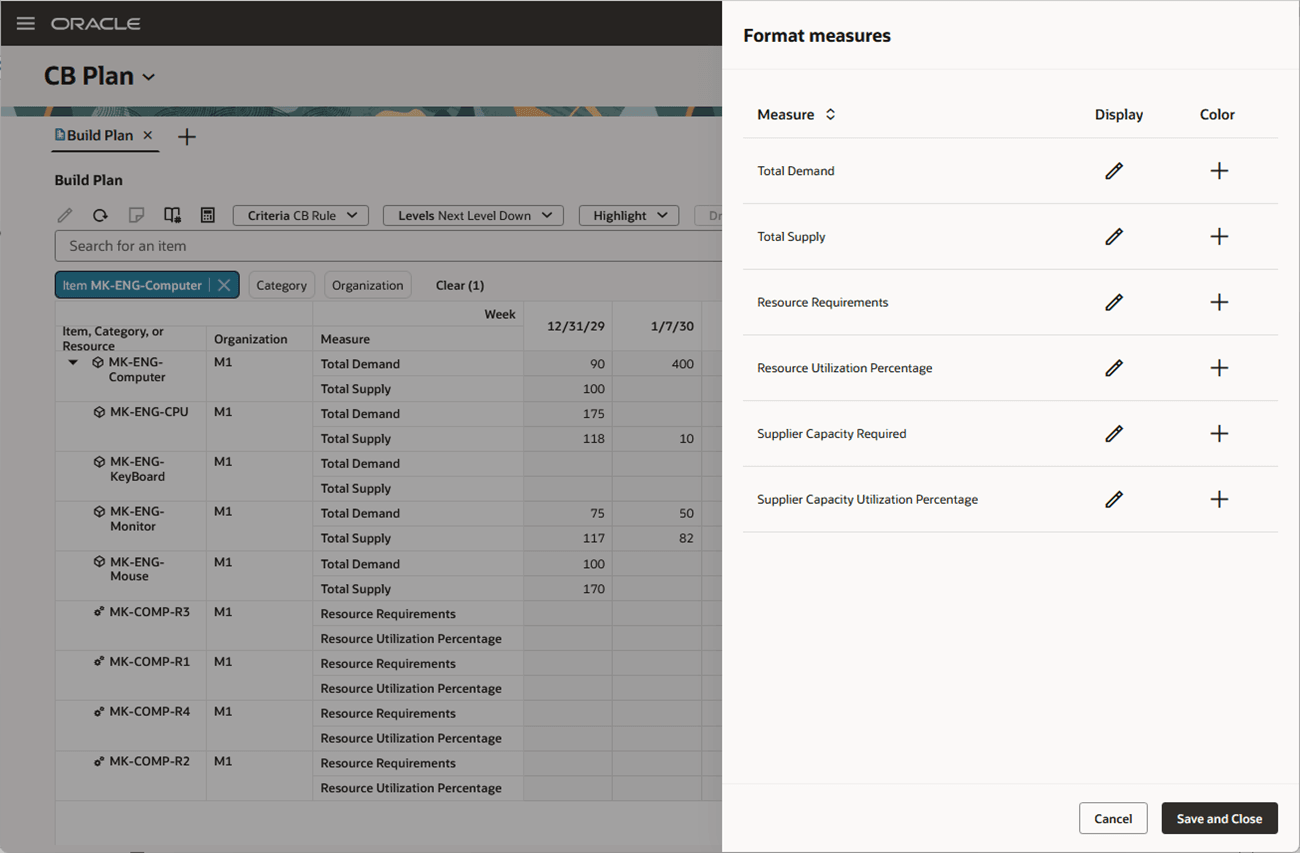
Format Measures Drawer
The Format measures drawer lists the measures included in the underlying build plan view. You can select whether to override the display characteristics of a measure and whether to apply color formatting to a measure.
Overriding Display Attributes
If, for example, you want to override the label of the Resource Requirements measure, click the pencil icon in the Display column of the Resource Requirements measure to edit the display attributes for this measure.
The display attributes for the selected measure, in this case Resource Requirements, are editable and you can override the label, data type, unit of measure, and other attributes. Some fields are disabled based on the selected data type. For example, if the value selected in the Data Type field is Currency, then the Price Lists and Currency fields are enabled, and the Unit of Measure field is disabled.
If you click the Restore Defaults button, any table-specific display formatting is removed and the formatting from the measure’s definition is displayed.
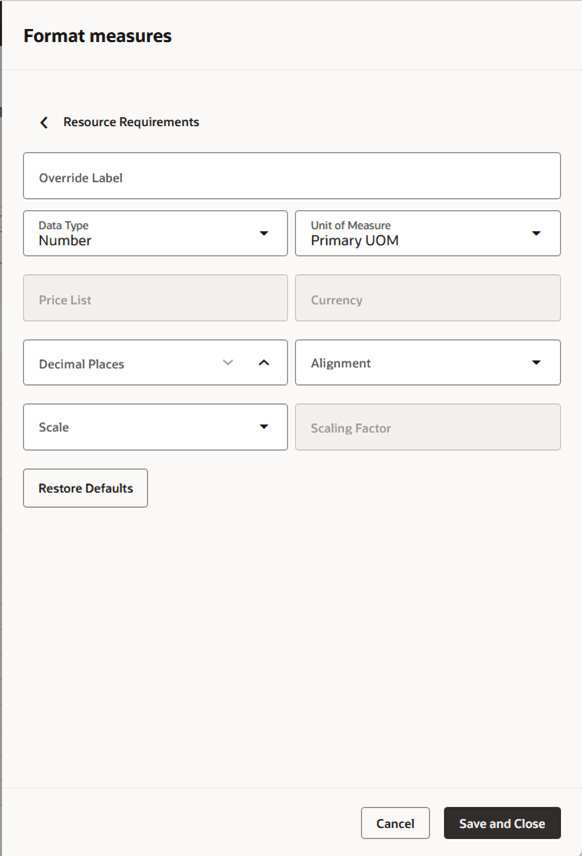
Editing Display Attributes in Format Measures Drawer
You can click the back arrow, located to the left of the measure name, to go back to the list of available measures and apply formatting to other measures.
Clicking the Save and Close button will save all formatting changes made since the last time you clicked this button. For example, you can click the back arrow and edit formatting for 3 more measures. When you click the Save and Close button, the formatting changes made for all 4 measures will be saved. If you click the Cancel button instead of the Save and Close button, then the pending formatting changes for all 4 measures are canceled and the Format measures drawer closes.
Conditional Color Formatting
You can also define color formatting rules using the Format measures drawer. If a measure has existing color formatting, you’ll see a pencil icon in the Color column to indicate that you can edit an existing color formatting rule, otherwise, you’ll see a plus icon to indicate that you can add a new rule. To add or edit color formatting for a measure, click on the icon in the Color column of the desired measure.
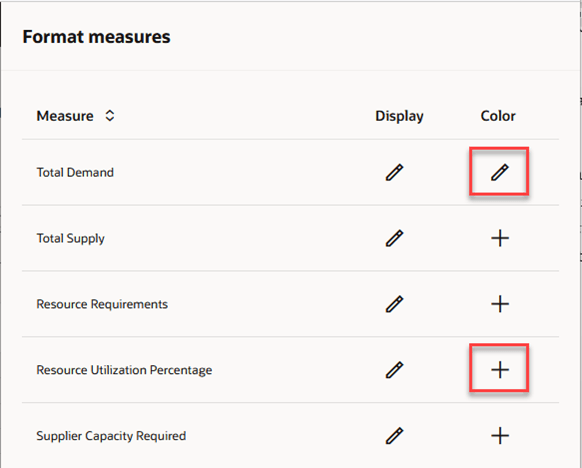
Icons Show Whether Color Formatting Exists
Clicking on the plus icon displays the available color formatting fields for the selected measure in add mode.
If you’ve used conditional formatting in the classic version of Build Plan, or if you’ve used conditional formatting in the Redwood version of Material Plan or other pivot tables, the fields that are displayed will be very familiar because the functionality is the same in all places.
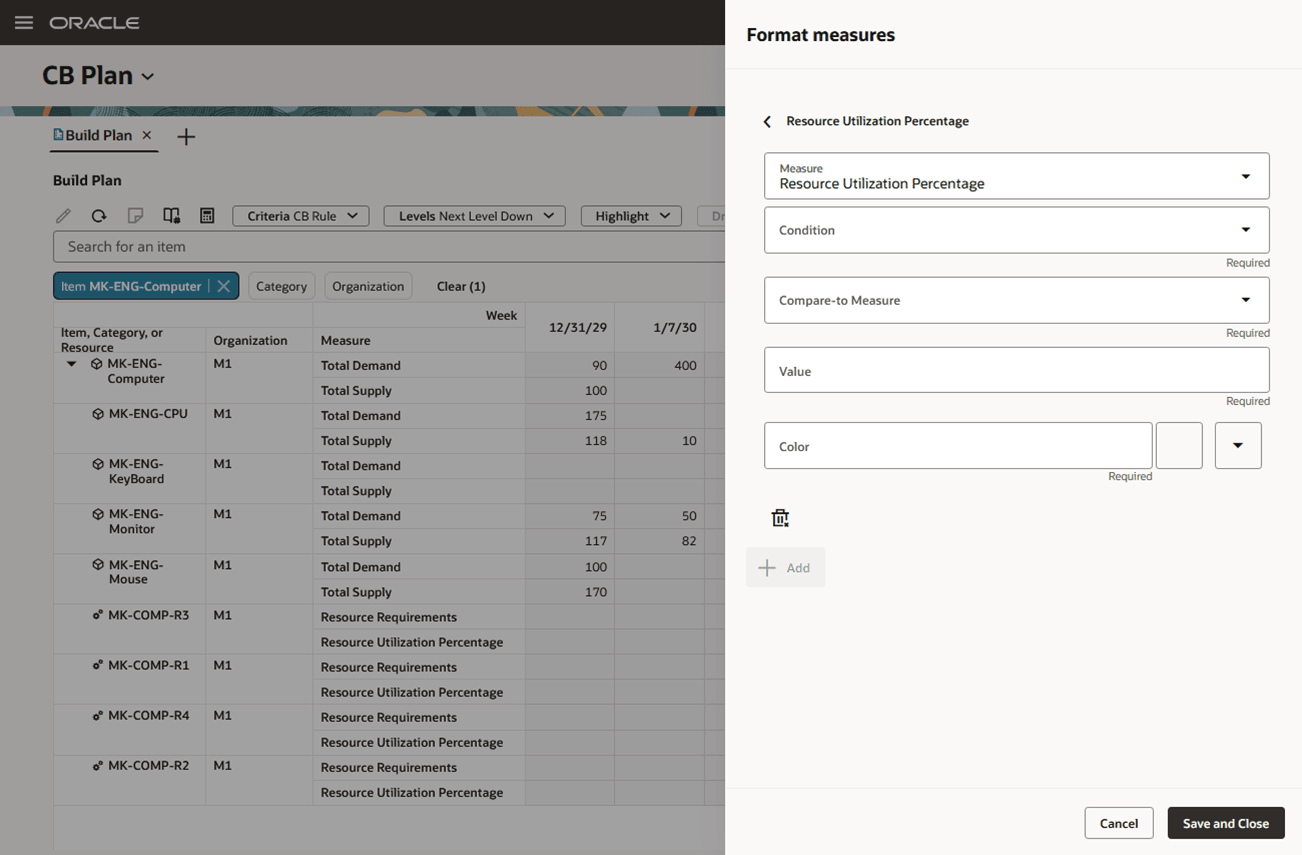
Adding Color Formatting Before Values Are Entered
When applying conditional formatting, the following conditions are available:
- < Less than
- > Greater than
- = Equal
- <= Less than or equal to
- >= Greater than or equal to
- <> Not equal to
Let’s say you want to color the background of a cell red if the Resource Utilization Percentage is over 100%. You would fill out the formatting as shown in the following image.
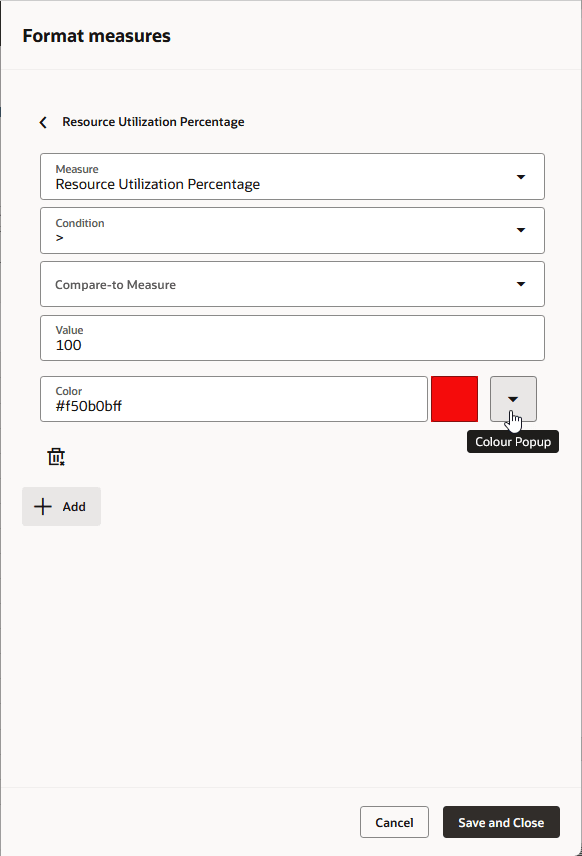
Color Formatting Example When Resource Utilization Is over 100%
In the preceding image, the cell’s background will be red if the Resource Utilization Percentage is greater than 100. Depending on the rule you want to create, you can either specify a hard-coded value, such as 100, or you can compare the difference between two measures.
There are times you may want to have different colors applied to a measure’s value to indicate the severity of an issue. For example, you may want to show a red background for critical issues and a yellow background for less critical issues.
For example, in the following image, we have two different conditional formatting rules applied to the Resource Utilization Percentage measure. If the measure value is over capacity (that is, greater than 100%) we want to show the cell’s background in red. If the measure value is approaching capacity (that is, greater than 90%, but less than or equal to 100%), we want to show the cell’s background in yellow.
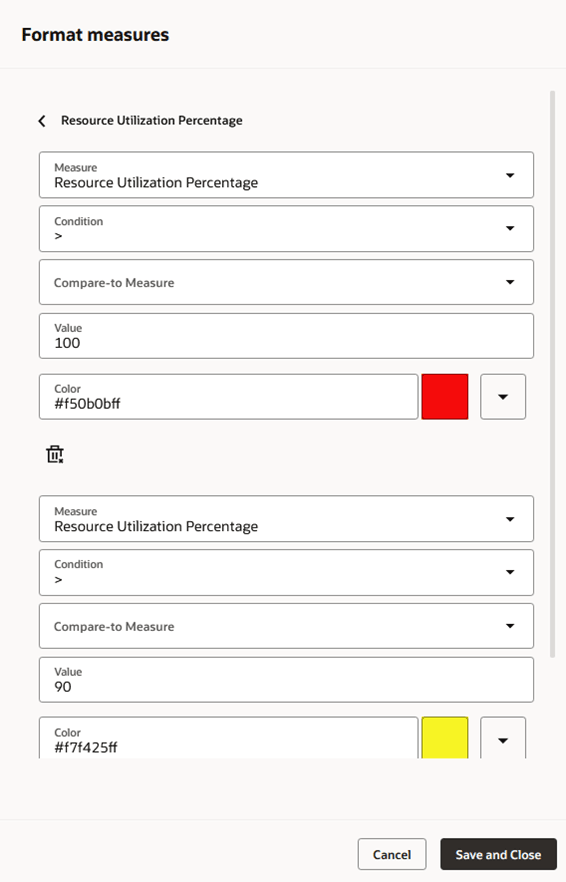
Multiple Conditional Formatting Example
When you have more than one conditional formatting for a measure, the first format listed in the Format measures drawer that meets the condition is applied.
Clicking Save and Close saves the conditional formatting, closes the Format measures drawer, and refreshes the build plan, applying any formatting where conditions are met. For example, in the following image, Resource Utilization Percentage cells that are greater than 100 are highlighted in red. Cells that are greater than 90, but less than or equal to 100 are highlighted in yellow.
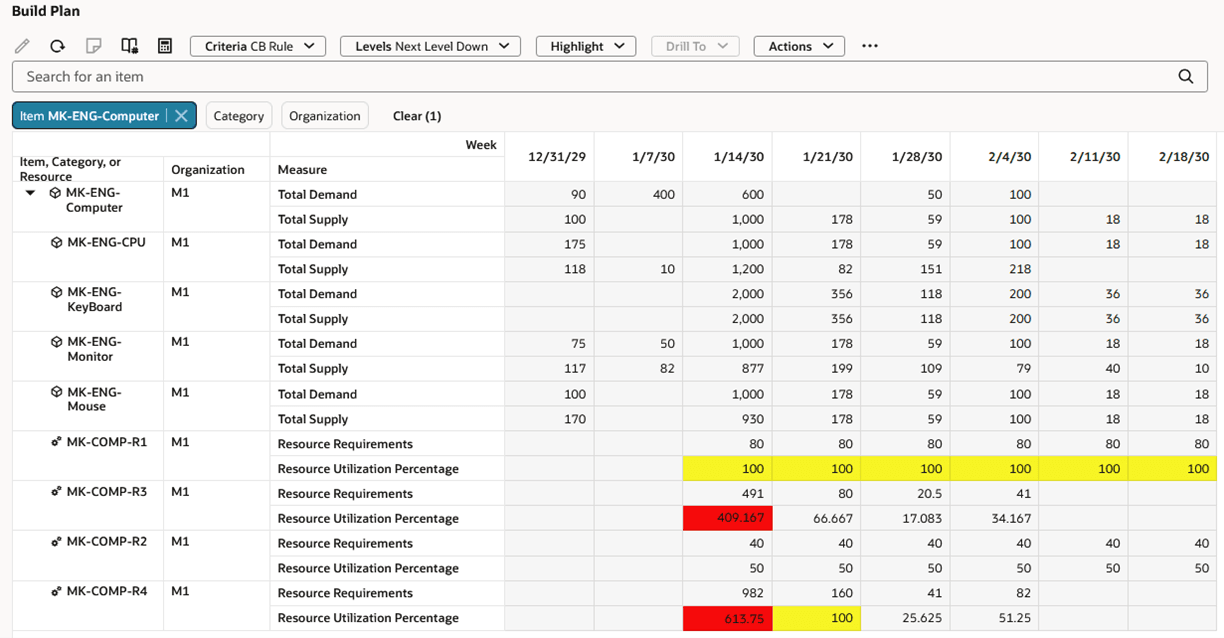
Build Plan with Conditional Formatting
Steps to Enable
You don't need to do anything to enable this feature.
Key Resources
- See Redwood: Manage a Build Plan Using a New User Experience in the Oracle Fusion Cloud Supply Planning 25B What’s New
- See Redwood: Analyze Build Plan with Additional Capabilities in the Oracle Fusion Cloud Supply Planning 25C What’s New
Access Requirements
Users who are assigned a configured job role that contains these privileges can access this feature:
- View Planning Items (MSC_VIEW_PLANNING_ITEMS_PRIV)
- Edit Planning Items (MSC_EDIT_PLANNING_ITEMS_PRIV)
- View Planning Objects Using REST Service (MSC_VIEW_PLANNING_OBJECTS_REST_SERVICE_PRIV)
These privileges were available prior to this update.