Redwood: Analyze Supply Plans with a Gantt Chart Using a New User Experience
A Gantt chart enables planners to effectively analyze the plan on the time axis. Analyze the timing and dependencies of planned supply chain activities using the new Redwood experience. You can adjust the plan interactively considering the information representing the guardrails. You can adjust the plan without violating upstream and downstream constraints.
Gantt Chart Overview
The Gantt Chart allows you to view orders and resource requirement durations on a timeline, along with their calculated attributes. You can also interactively adjust the planned dates for supplies or resource requirements directly within the chart.
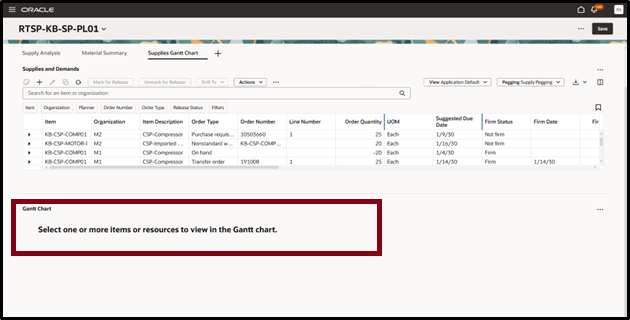
The Gantt Chart can only be opened in context by drilling down from another table. It typically opens in a different tab from the one you drilled from. However, in the Resources Gantt Chart and Supplies Gantt Chart pages, drilling down from the Supplies and Demands table or the Resource Requirements table displays a split view layout, with the Gantt Chart displayed in the lower pane.
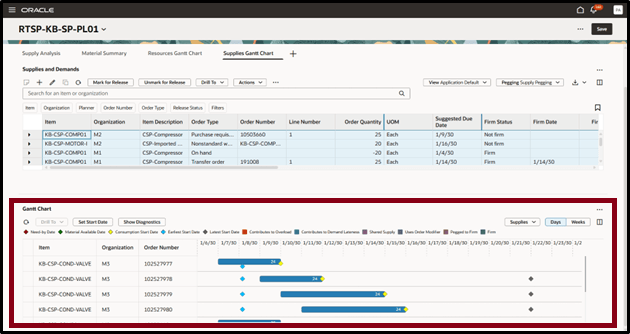
Supplies Gantt Chart
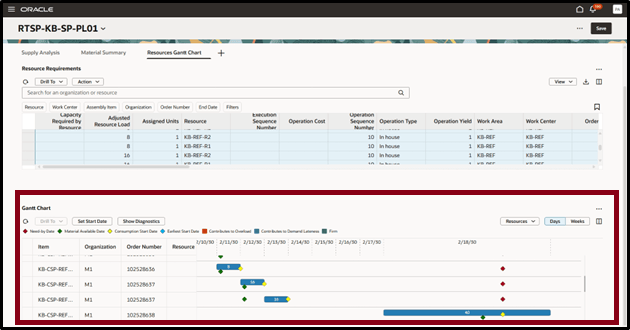
Resources Gantt Chart
Gantt Chart Toolbar
The following screenshot shows the Gantt Chart toolbar.
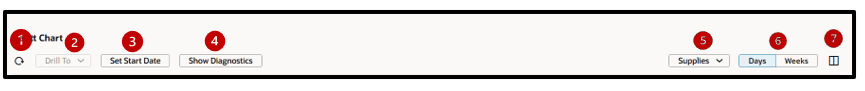
The actions available on the Items toolbar are:
- Refresh: Select this option to:
- Notify you if there are unsaved changes. Any unsaved changes made to the table are discarded.
- Refresh the content in the Gantt Chart.
- Drill To: Pass the context to another table by selecting Gantt chart bar. This action will open the selected table or graph on a different temporary page.
- Set Start date: Select to set the date from when you want to see the Gantt chart. This action button opens a drawer where you can set the start date.
- Show Diagnostics: Select to open the drawer where you can select one or more diagnostic attributes.
- Supplies/Resource Switcher: View the orders or resource requirements durations on a timeline along with the calculated attributes for the context selected.
- Time Period: The time period planning buckets where you can select to view the granularity of order or resource requirements based on the planning calendar assigned to the plan.
- Columns: Select and arrange the columns in your preferred order in the Gantt Chart table to suit your needs. You can reorder columns by grabbing the handle and moving the column up or down in the Columns drawer.
Drill to
You can seamlessly navigate to other related tables using the Drill To feature while maintaining the context based on specific filtering criteria.
Drill-To Example: From Resources Gantt Chart to Resource Plan
In this example, a resource plan is opened via a Drill-To action from the Resource Gantt Chart. The Filtered By value in the table view displays the active columns and filter criteria applied during the drill action.
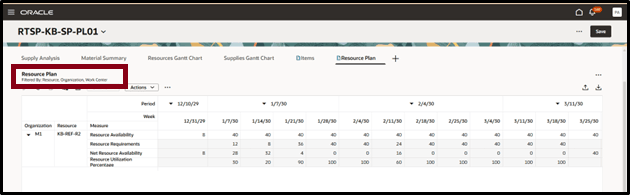
Drilling to a Resource Plan from a Resource Gantt Chart\
The cells corresponding to the Resource Requirements measure in the Resource Plan, Build Plan, or a user-defined table can be drilled to Gantt Chart.
Drill-To Example: From Supplies Gantt Chart to Material Plan
In this example, a Material Plan is opened via a Drill-To action from the Supplies Gantt Chart. The Filtered By value in the table view displays the active columns and filter criteria applied during the drill action.
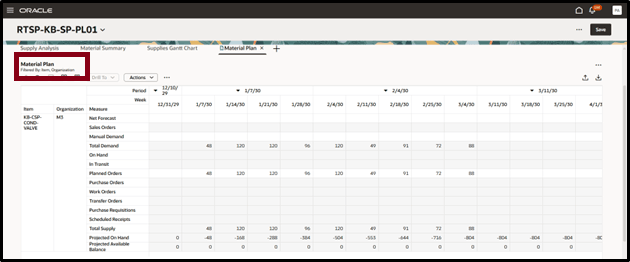
Drilling to Material Plan from Supplies Gantt Chart
The cells corresponding to these measures in the Material Plan, Build Plan, or a user-defined table can be drill to Gantt Chart.
- Total Supply
- Planned Orders
- Scheduled Receipts
- Purchase Orders
- Purchase Requisitions
- Transfer Orders
- Work Orders
- Dependent Demands
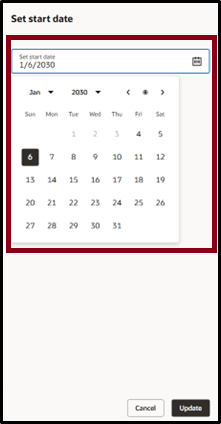
Set Start Date
This action button opens a drawer where you can set the start date as shown in the given screenshot. The Gantt Chart then displays the data beginning from the selected start date.
Show Diagnostics
Use the Show Diagnostics option and choose the diagnostic attributes you want to display for orders and resource requirements.
These are the diagnostic attributes that you can display in your Supplies Gantt Chart:
- Contributes to Demand Lateness
- Contributes to Overload
- Consumption Start Date
- Need-by Date
- Material Available Date
- Earliest Start Date
- Shared supply
- Uses Order Modifier
- Pegged to Firm
- Firm
Supplies Diagnostics
These are the diagnostic attributes that you can display in your Resources Gantt Chart:
- Contributes to Demand Lateness
- Contributes to Overload
- Consumption Start Date
- Need-by Date
- Material Available Date
- Earliest Start Date
- Firm
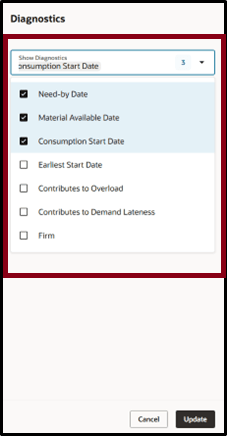
Resource Diagnostics
Move In and Move Out
You can move the Supplies or Resource Requirements bar by dragging and dropping highlighted by a color. However, you can't move a bar to another row.
- The end date of the supply bar always snaps to the last working day of the planning time bucket that you move the bar to.
- If you move a bar to a non-working day within the daily bucket portion of the plan horizon, you are asked if you want to move it to the previous working day.
After you are satisfied with moving the bar in or out, use the SAVE button to save your actions and replan it to align the supplies and resource loading based on it.
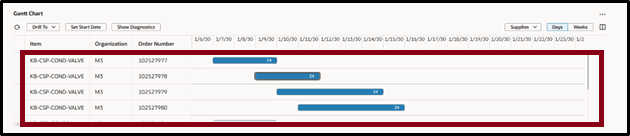
Before User Action
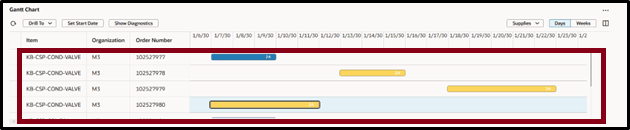
After Moving the Bars
Here's the demo of these capabilities:
Steps to Enable
You don't need to do anything to enable this feature.
Tips And Considerations
When the Supplies Gantt Chart or Resource Gantt Chart is opened for the first time, you must select the items or resources for which you want the Gantt Chart to be displayed.
Key Resources
- Release 25B What’s New: Redwood: Analyze Supply Plans Using a Configurable Redwood Page
- Release 19D What’s New: Diagnose Planning Issues Using Calculated Order Attributes and Gantt Charts
Access Requirements
Users who are assigned a configured job role that contains these privileges can access this feature:
- View Planning Tables Area (MSC_ MSC_VIEW_PLANNING_TABLES_PRIV_PRIV)
- Maintain Planning Tables Area (MSC_ MSC_MAINTAIN_PLANNING_TABLES_PRIV_PRIV)
These privileges were available prior to this update.