Redwood: Create a Duplicate of an Existing Visualization
You can use the Redwood user experience to duplicate visualizations. You can change the visualization type dynamically. Duplicating a table as a graph creates a basic bar chart with measures on the X-axis and dimensions on the Y-axis. Duplicating a graph as a table converts measures into columns and displays one dimension as rows. The duplicated visualization opens as a temporary page with the properties drawer preloaded. Finalize the settings and save as a result, thus speeding up the standardization process and sharing across plans.
Duplicating a pivot table or graph helps you in planning analysis, collaboration, and scenario modeling. It enables you to quickly create variations of existing analyses without having to rebuild them from scratch.
You can:
- Create a graph from a pivot table and vice-versa: This gives you flexibility in how you analyze your data. Use a pivot table for detailed comparison and filtering and switch to a graph when you want to quickly see trends and patterns. This lets you move smoothly between high-level insights and deeper analysis without rebuilding your view, helping you work more efficiently and make faster decisions.
- Create different views: Create multiple versions of the same table or graph to show different levels of detail, specific exceptions, or filtered subsets of data.
- Duplicate a graph: Apply different filters, measures, or grouping options to the duplicate version to see how a change in a planning analysis might affect the plan.
- Compare data sets: Compare data from different plan runs or scenarios. For example, you can duplicate a chart, apply a before scenario to one and an after scenario to the other, and then compare them visually. This is helpful in collaboration and saves time and effort when looking to leverage existing planning assets created by you and other planners in your organization. You can replicate complex, configured pivot table or graph, saving significant time and reduce the risk of errors.
- Preserve layout and settings: Duplicating a visualization copies all the existing settings, including measure configurations, formatting, filters, and layouts. Create a new version with only minor modifications instead of re-entering every detail.
- Rapid prototyping: Use a duplicate visualization as a starting template to quickly test and build new custom analyses.
- Create custom views for different teams based on stakeholder’s relevance: Duplicate a master graph and then personalize each copy for specific stakeholders or departments, highlighting the metrics most relevant to them.
- Share insights with public visualizations: Create a duplicate of an analysis to share with other users, who can then explore the data further without altering the original analysis. Duplicated visualizations can be made public for wider access or shared with a specific list of users.
Working with Visualizations
You can easily create new visualizations by duplicating the existing ones. This helps maintain consistency in layout and formatting while enabling users to adjust measures, dimensions, filters, or chart types as needed.
You can:
- Duplicate a pivot table to another pivot table: Create a copy of the selected pivot table to modify the copied version independently. For example, to apply different measures, hierarchies, or filters.
- Duplicate a pivot table to a graph: Convert the structure and data of a pivot table into a visual chart. This is useful when a tabular data view needs to be presented in a more visual format for trend or comparative analysis.
- Duplicate a graph to another graph: Copy an existing graph while retaining its formatting, metrics, and display properties. The duplicated chart can then be adjusted to present variations of the data without recreating the visualization from scratch.
- Duplicate a graph to a pivot table: Transform a graph visualization back into a structured pivot table format. This is beneficial when the visual trend needs to be examined in more detail or reviewed at a more granular data level with numerical values.
Duplicating a visualization
To duplicate a visualization:
1. On the page, click the Edit icon.
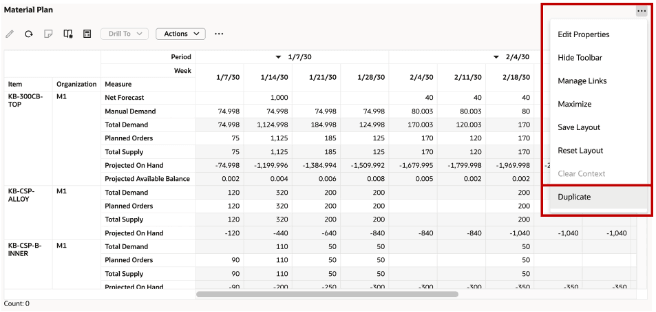
2. From the menu options, select Duplicate. Depending on the type of visualization you are duplicating for, pivot table or graph, you will see a change in the visualization.

Duplicate Option
Note: You may need to make changes to the properties such as data, layout, and visualization of the visualization to make it suitable for your requirement.
The Duplicate drawer opens.
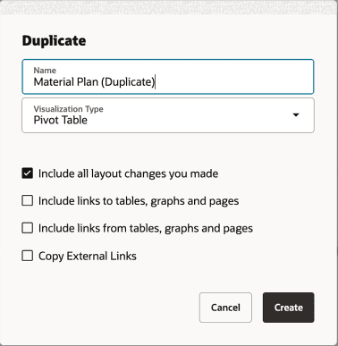
Duplicate Drawer
3. Enter a name. The name of the of the original table or graph is populated. By default, Duplicate is added to the original name.
4. Select the visualization type you want to change to.
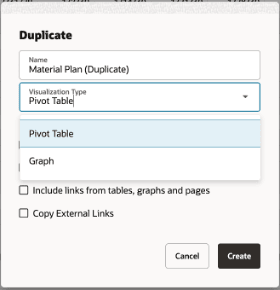
Visualization Type
5. Select the options based on your preferences:
- Include all your layout changes: Selected by default. Use this option when you want the duplicate to closely match the original but want to adjust only certain parts such as change the time bucket or add/remove a measure.This includes:
- Selected measures and attributes
- Filters and search conditions
- Sorting and formatting
- Time level selections
- Column and row configurations
- Include links to tables, graphs, and pages: Select this option if the original component contains outgoing navigation links, such as drill-downs or links to other pages in the planning work area. Use this when you want the duplicate visualization to maintain the same navigation behavior.
- Include links from tables, graphs, and pages: Select this option to carry over incoming navigation links from other pages or components that direct users to this view. Use this when the duplicate visualization must also be a landing view in navigation flows, such as dashboard-style layouts.
- Include links to external systems: Select this option to retain any external hyperlinks. For example, links opening:
- Oracle Cloud applications,
- ERP and Analytical systems
- Other external reporting systems
- Use this option when your analysis workflow depends on external references, and you want them fully accessible in the duplicate visualization.
Duplicate Options
Important Points to Consider
When you are changing the visualization from a pivot table to a graph visualization and if the pivot table has multiple dimensions, only one of them will be shown in the graph. You can change the graph’s properties in the edit properties options. In the given screenshot, the calendar dimension is the horizontal dimension after the transformation of the pivot table to a graph visualization.
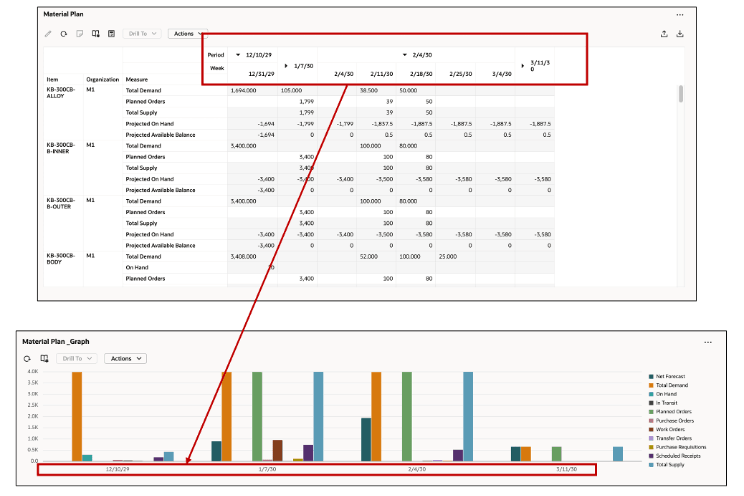
Changing a Visualization from a Pivot Table to a Graph
When you are changing the visualization from a graph to pivot table, the measures that are on the horizontal axis will appear as innermost rows in pivot table. This is the expected behavior. You can adjust the layout in the newly created pivot table’s layout properties. In the given illustration, the resource measures have transformed to the innermost rows in the pivot table.
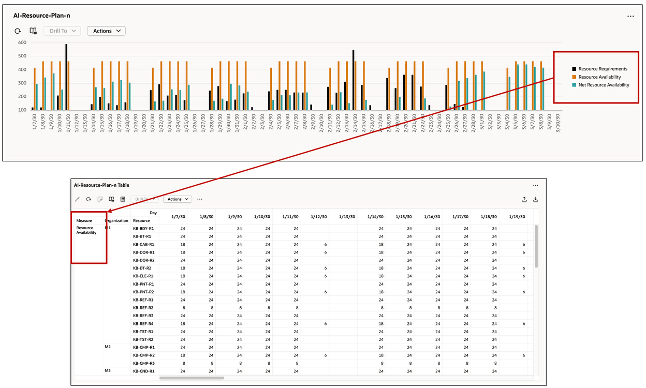
Changing a Visualization from a Graph to a Pivot Table
Steps to Enable and Configure
Use the Opt In UI to enable this feature. For instructions, refer to the Optional Uptake of New Features section of this document.
Offering: Supply Chain Planning
Tips And Considerations
If you want to use the Redwood: Create a Duplicate of an Existing Visualization feature, then you must opt in to its parent feature: Replenishment Planning. If you’ve already opted in to this parent feature, then you don’t have to opt in again.
Access Requirements
Users who are assigned a configured job role that contains these privileges can access this feature:
- Edit Planning Analytics Configuration
- (MSC_EDIT_PLANNING_ANALYTICS_CONFIGURATION_PRIV)
- View Planning Analytics
- (MSC_VIEW_PLANNING_ANALYTICS_CONFIGURATION_PRIV)
- Maintain Planning Tables
- (MSC_MAINTAIN_PLANNING_TABLES_PRIV)
- Delete Planning Tables
- (MSC_DELETE_PLANNING_TABLES_PRIV
- View Planning Objects
- (MSC_VIEW_PLANNING_OBJECTS_REST_SERVICE)
These privileges were available prior to this update.