Redwood: Graph an Item's Availability in Order Management
Use bar charts to graphically compare the total, available, and assigned supply for an item across one or more organizations and supplier sites. Before update 26A, the Supply Availability page displayed these details only in tables.
Realize these benefits:
- View your total, available, and assigned supply for each item across one or more organizations and supplier sites in one visual display.
- Compare supply across your supply chain with bar charts so you can quickly diagnose shortages and delays.
- See how much supply is immediately available to promise new orders according to the most recent data that you collect.
- Filter supply according to date, item, customer, or region to focus on the data that matters most.
- Display results according to your organization, your drop-ship suppliers, or both so you can see the entire supply picture.
- Identify gaps between shelf quantity and assigned quantity so you can act before supply runs short.
- Analyze availability at different assignment levels, from item and customer to region and global, to understand where choke points exist.
Try It:
- Go to Home > Order Management > Show More > ctrl+f > Item Availability.
- Set the attributes, then click Submit.
- Examine the results:
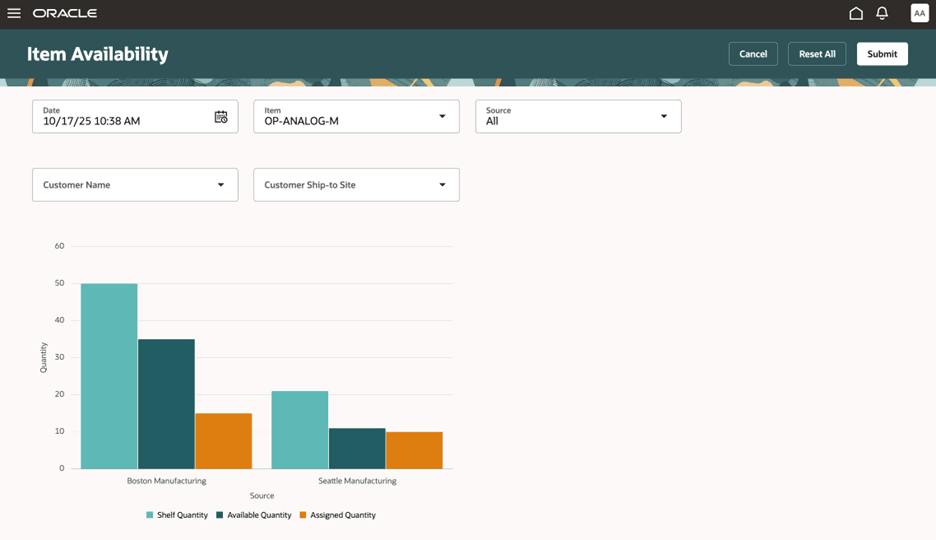
Item Availability Report
|
Quantity |
Value |
|
Shelf |
Quantity that's available according to the most recent data that you collect. |
|
Assigned |
Quantity that sales orders have consumed. |
|
Available |
Quantity that's immediately available to promise new sales orders. |
Consider:
- The available quantity equals the shelf quantity minus the assigned quantity.
- Filter data according to item and date.
- Filter according to customer or items that use sourcing rules at the customer or regional level.
- Display the report according to your organization, the suppliers that you use for drop shipments, or both.
You can filter search according to assignment level, from most specific to least specific:
|
Specificity |
Assignment Level |
Filter Criteria |
|
1 |
Item and customer and site |
Customer and customer site |
|
2 |
Item and customer |
Customer and customer site |
|
3 |
Item and demand class |
Not Supported |
|
4 |
Item and region |
Customer and customer site |
|
5 |
Category and customer site |
Customer and customer site |
|
6 |
Category and Customer |
Customer and customer site |
|
7 |
Category and demand class |
Not Supported |
|
8 |
Item |
Not applicable |
|
9 |
Category and region |
Customer and customer site |
|
10 |
Category |
Not applicable |
|
11 |
Customer and customer site |
Customer and customer site |
|
12 |
Customer |
Customer and customer site |
|
13 |
Demand class |
Not Supported |
|
14 |
Region |
Customer and customer site |
|
15 |
Global |
Not applicable |
See Consider Your Sourcing Hierarchy and Assignment Set Hierarchy.
Steps to enable and configure
You must collect the entities that you want to use in the report. See Collect Data for Global Order Promising.
Tips and considerations
The shelf quantity includes the supply that sales orders consume on the system date. The assigned quantity doesn't include that supply.
Key resources
Access requirements
Users who are assigned a configured job role that contains this privilege can access this feature:
- View Supply Availability Report (MSP_VIEW_SUPPLY_AVAILABILITY_REPORT_PRIV)
This privilege was available prior to this update.