Redwood: Manage Pegging Analysis Using a New User Experience
Oracle Supply Planning generates the pegging of the demand to supply at all levels of the supply chain. You can now analyze the pegging records using a Redwood page that enables you to view the supply quantity or supply percentage that’s pegged to demands at the next level down in the supply chain or all the way down to the end item.
The Pegging Analysis visualization is opened using the drill-to action. For example, within Material Plan you can select one or more cells and bring the context of those cells into Pegging Analysis, or you can select one or more rows from Supplies and Demands and bring the context of that supply or demand into Pegging Analysis.
Let’s take an example scenario where you’ve been informed that a particular purchase order for a component item has been delayed and you want to use the Pegging Analysis visualization to analyze what end items are affected. From Supplies and Demands, you select the purchase order in question and drill to Pegging Analysis.
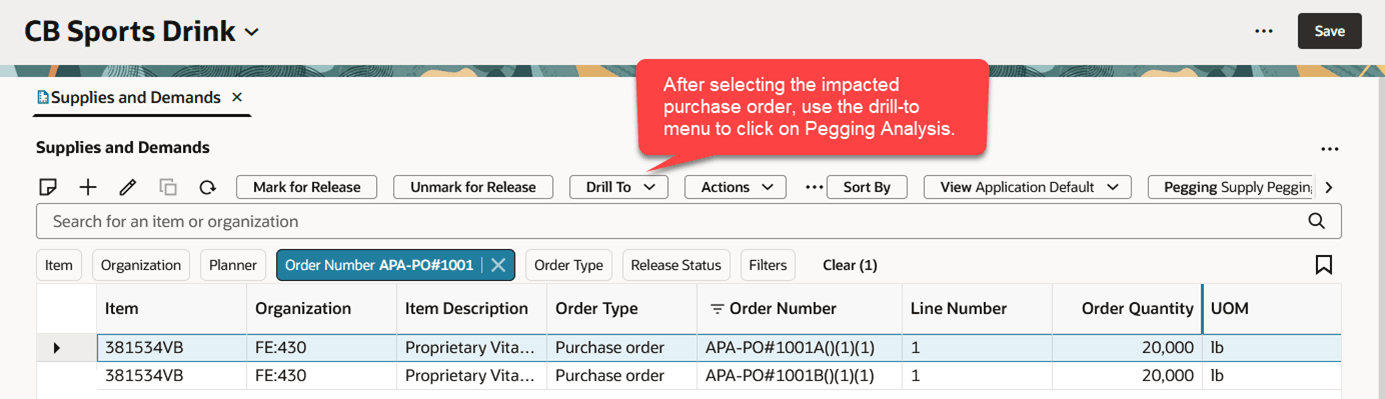
Opening Pegging Analysis Using Drill To Menu
The selected purchase order is brought in as context to the Pegging Analysis visualization. The default set of criteria are applied to determine how the pegging information is displayed. In the following example, the Application Default criteria was used.
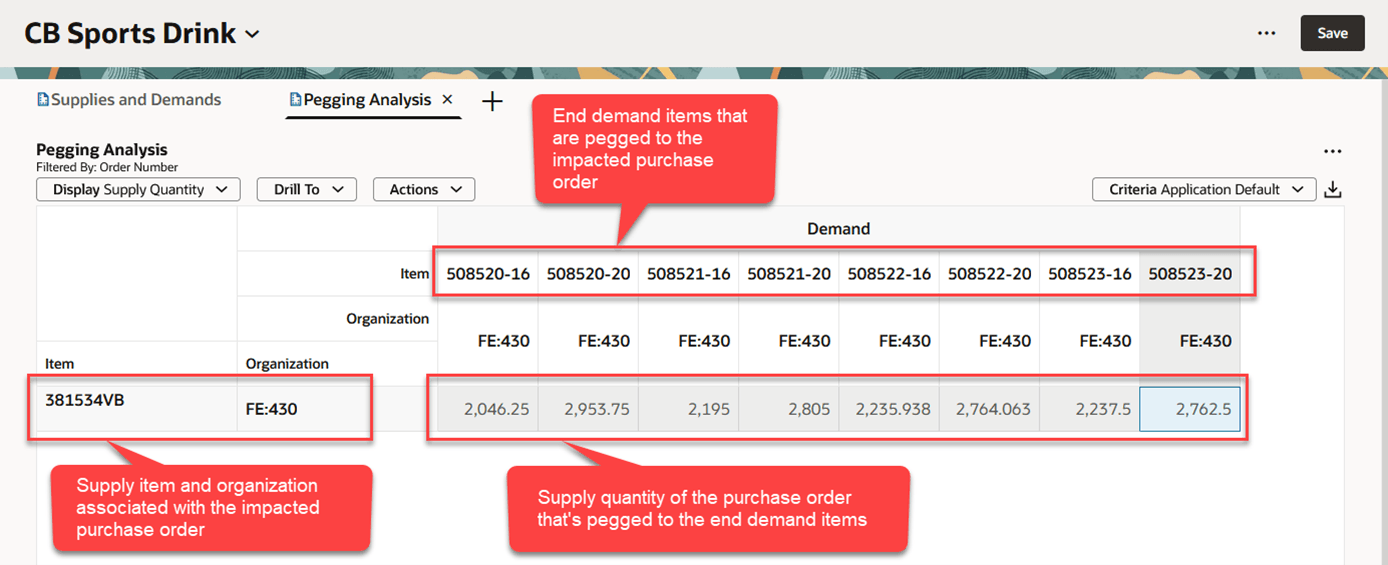
Pegging Analysis Example Showing Supply Quantity
In the preceding example, you can see there are eight end demand items that are consuming the purchase order’s component item. In addition, you can see the supply quantity that each end demand item is consuming. You can switch between displaying supply quantity or supply percentage using the Display button on the toolbar.
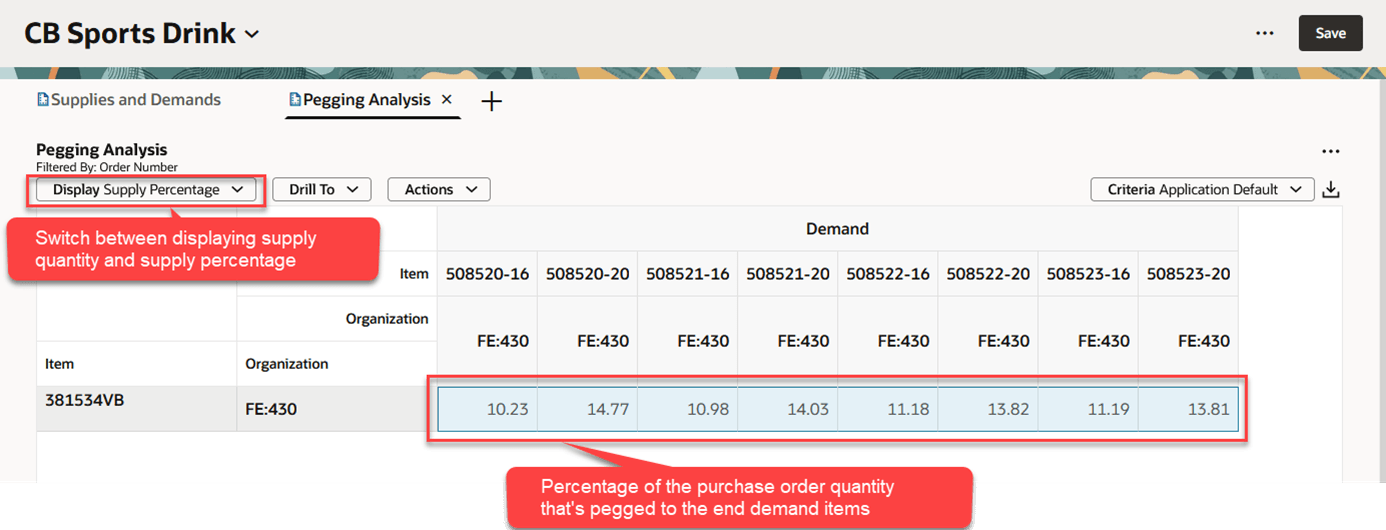
Pegging Analysis Example Showing Supply Percentage
When Supply Percentage is selected, the value in each cell represents the percentage of the supply’s quantity that’s pegged to the end demand item. If desired, you can select the Show Summary action from the Actions menu to display a total across all pegged end demands, as shown in the following example.
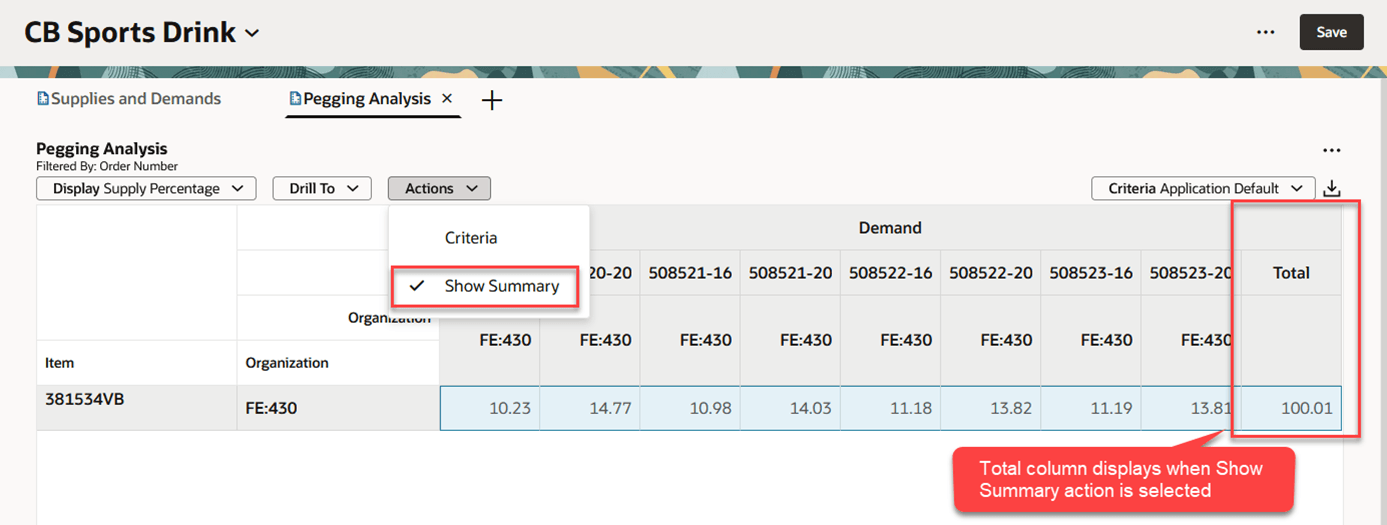
Pegging Analysis Example with Total Column
Configuring Criteria
As mentioned earlier, the selected criteria determines how the Pegging Analysis pivot table is configured. Select the Criteria action from the Actions menu to open a drawer containing the list of available criteria.
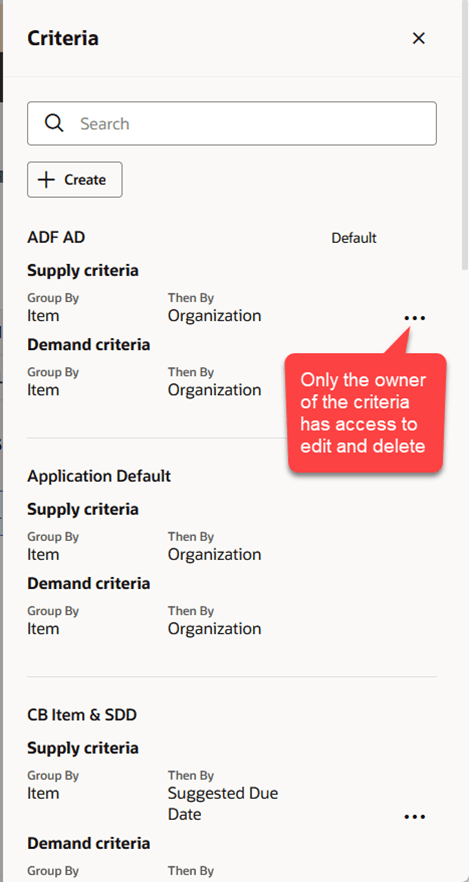
Criteria Drawer
If you’re the original creator of the criteria, you can access the edit and delete actions from the Actions (…) menu. To create a new criteria, click the Create button.
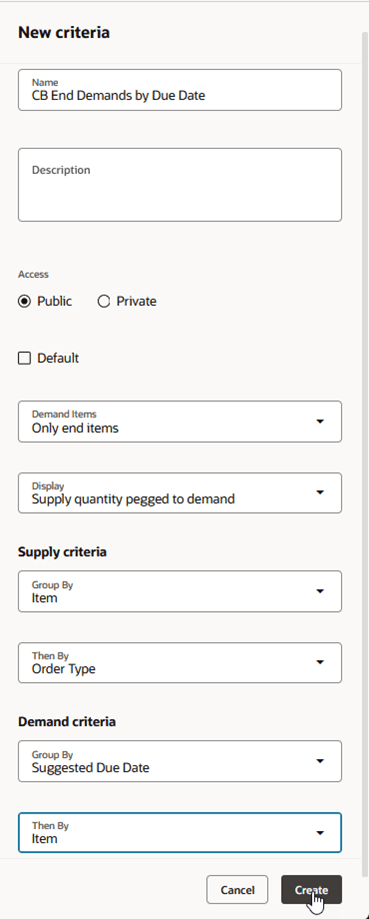
New Criteria Drawer
Complete the New criteria drawer as follows:
Name. Enter a unique name for your criteria.
Description. Optionally, assign descriptive text to further describe the criteria.
Access. Select Public to make the criteria visible to others. Select Private to make the criteria visible only to you.
Demand Items. Select Only next level to display pegging of the supply item’s immediate parent item. Select Only end items to display pegging to the end item.
Display. Select whether to display the Supply quantity pegged to demand or the Supply percentage pegged to demand.
Supply Criteria. Select one or two fields that you want to group supplies by. What you select here becomes the row headers in the Pegging Analysis table. Your choices for grouping supplies are:
- Item
- Organization
- Order Type
- Supplier
- Suggested Due Date
- Category
Demand Criteria. Select one or two fields that you want to group demands by. What you select here becomes the column headers in the Pegging Analysis table. Your choices for grouping demands are:
- Item
- Organization
- Order Type
- Customer
- Suggested Due Date
- Category
Click Create to save your criteria.
Selecting the criteria created in the preceding example would result in the following Pegging Analysis table.
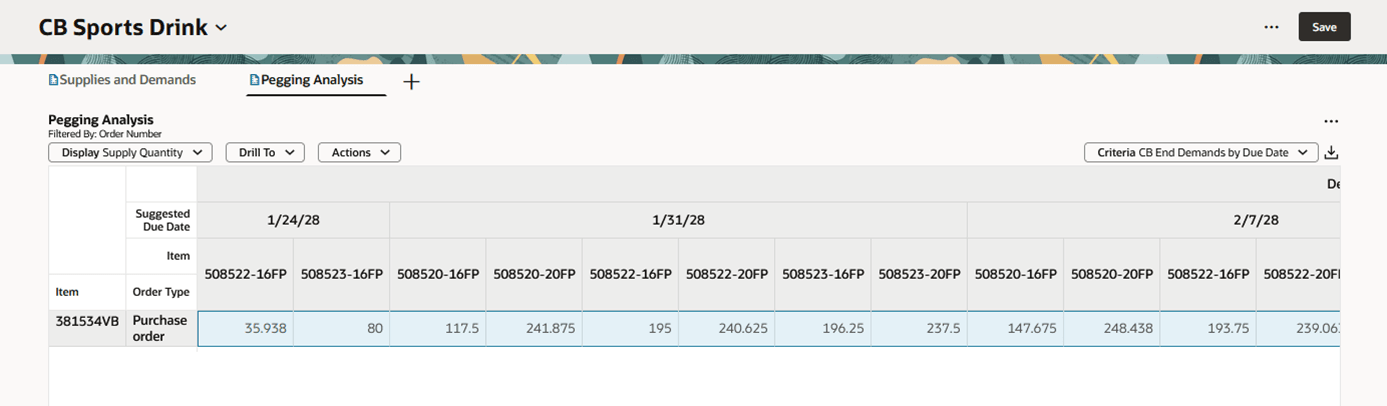
Pegging Analysis Example Using CB End Demands By Due Date Criteria
Drilling from Pegging Analysis
You can drill from Pegging Analysis to other visualizations. The context of the selected cells is passed to the target visualization. One thing that’s unique about the Drill To menu in Pegging Analysis is that you have three choices for drilling to supplies and demands.
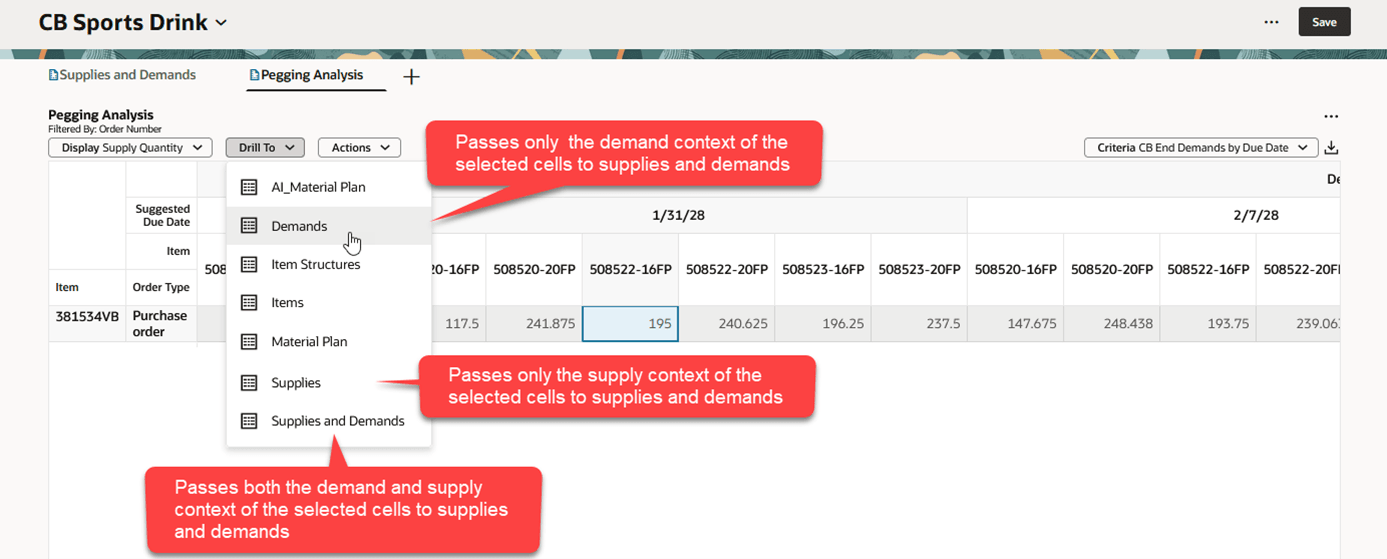
Drill To Menu
- The Demands drill-to action passes the demand context associated with the selected cells to the Supplies and Demands visualization.
- The Supplies drill-to action passes the supply context associated with the selected cells to the Supplies and Demands visualization.
- The Supplies and Demands drill-to action passes both the demand and supply context associated with the selected cells to the Supplies and Demands visualization.
For example, selecting the Demands drill-to action from the preceding image will open Supplies and Demands as shown in the following image.
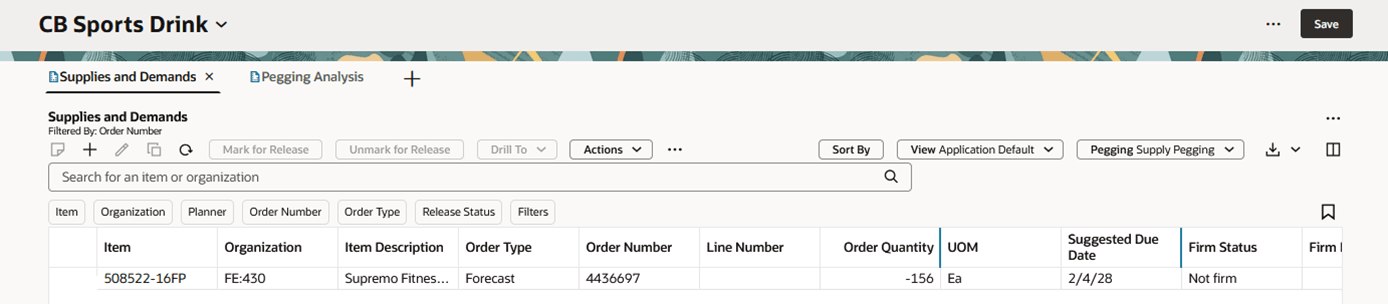
Drilling to Supplies and Demands Using Demand Context
Here we see only the end demand, in this case the forecast, for item 508522-16FP. Had we selected the Supplies and Demands drill-to action, we would have seen both the forecast for item 508522-16FP as well as the purchase order for item 381534VB.
Steps to enable and configure
You don't need to do anything to enable this feature.
Tips and considerations
- Pegging Analysis can’t be opened from the Visualizations tab, it can only be opened via a drill-to action.
- Pegging Analysis is a read-only view. To make any edits to plan data, you must drill to another visualization, such as Supplies and Demands or Material Plan.
Access requirements
Users who are assigned a configured job role that contains these privileges can access this feature:
- View Demands and Supplies (MSC_VIEW_DEMANDS_AND_SUPPLIES_PRIV)
- Edit Demands and Supplies (MSC_EDIT_DEMANDS_AND_SUPPLIES_PRIV)
- View Planning Objects Using REST Service (MSC_VIEW_PLANNING_OBJECTS_REST_SERVICE_PRIV)
These privileges were available prior to this update.