 Redwood: Diagnose Scheduling Delays in Order Promising
Identify the component, material, supplier, resource, or other factor that delays an order line, to understand why it doesn’t meet the request date. View the sources of delay for each alternative option to help you decide whether it’s easier to use one of them to resolve the delay.
You can review the sources, calendars, lead times, and other criteria that order promising uses to schedule selected items. A graph highlights any delays related to materials, capacity, or suppliers that prevent the order line from meeting its request date. You can use these insights to help resolve the delay, such as by adjusting item allocations or expediting transportation.
The Scheduling Diagnostics tool provides unique insight into the order promising process by detailing the steps followed, search paths traversed, constraints encountered, solutions considered, and the finalized solution returned.
The Scheduling Diagnostics tool supports the following capabilities:
- Displaying the order promising process both graphically as well as in a tabular form, as Oracle Global Order Promising processes a selected order either through Check Availability or regular order submission (Auto Schedule).
- Detailing the sequence of search steps followed and supply sources that participated in the search for an optimal order promising solution.
- Highlighting the critical components and resources that caused the supply search to return a delayed result. Capturing a snapshot of information to help identify the cause of delay (end item, component, or resource availability, calendars, lead times, as well as other relevant parameters).
- Capturing the state of the order promising system, such as need-by dates, supply discovered dates, and a time-phased supply-demand picture.
You can invoke Scheduling Diagnostics on demand for an order while running Check Availability from Oracle Fusion Cloud Order Management, or it can be automatically calculated for qualified orders during regular order submission (Auto Schedule) and then later viewed.
Check Availability
Select an order line in the Oracle Order Management UI and invoke Check Availability.
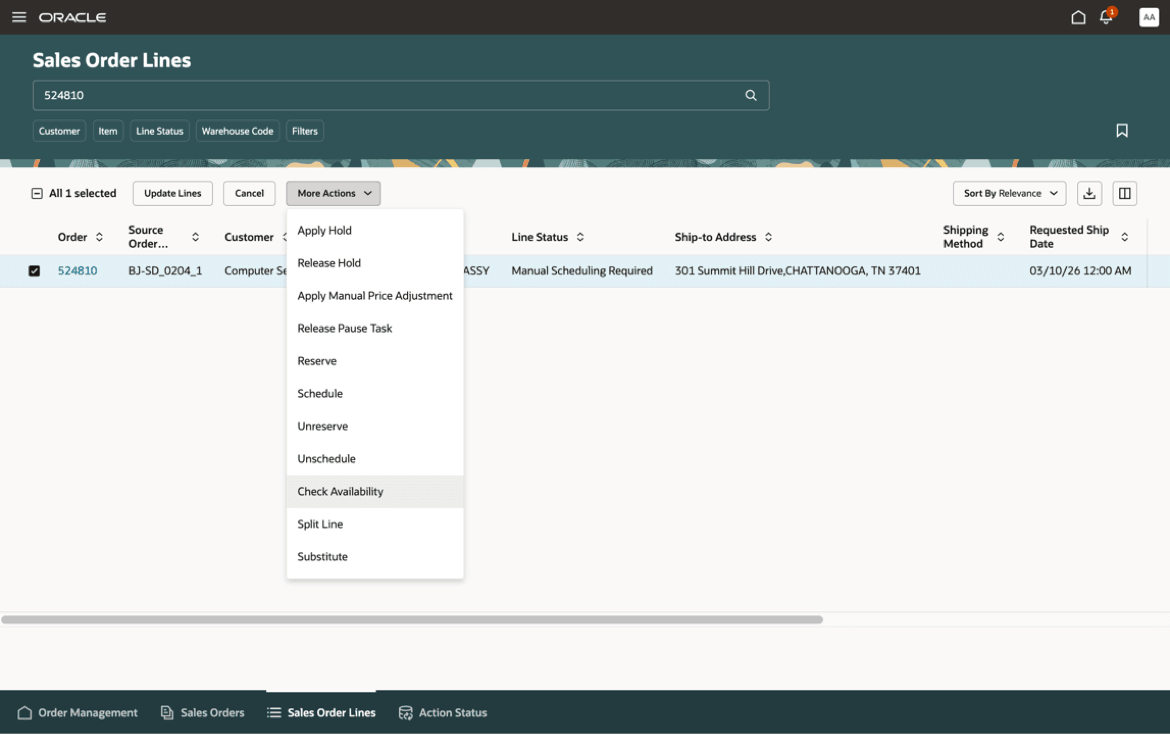
Order Selection and Check Availability Invocation in Oracle Order Management
On the Check Availability page, select the order line, and then select Run Scheduling Diagnostics from the Actions menu.
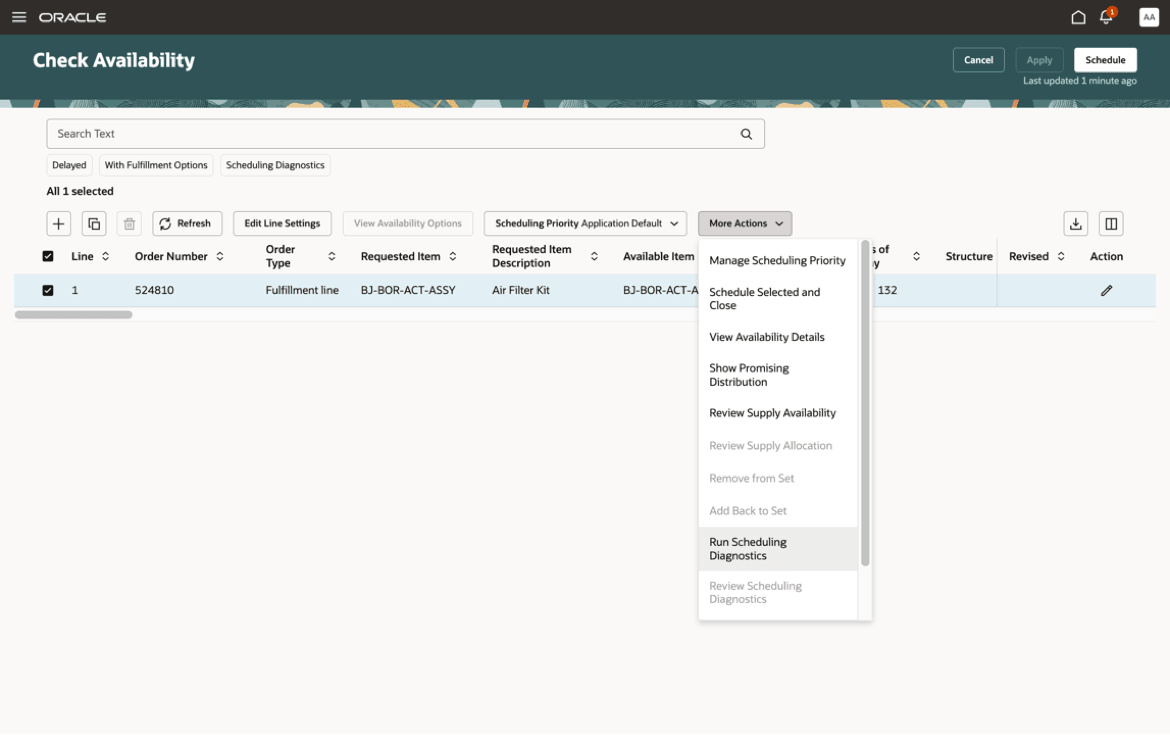
Order Selection and Scheduling Diagnostics Invocation on Check Availability Page
After the diagnostic generation completes, a banner message is displayed with a link to view the report. After clicking the link, a graphical view of the Scheduling Diagnostics page is displayed.
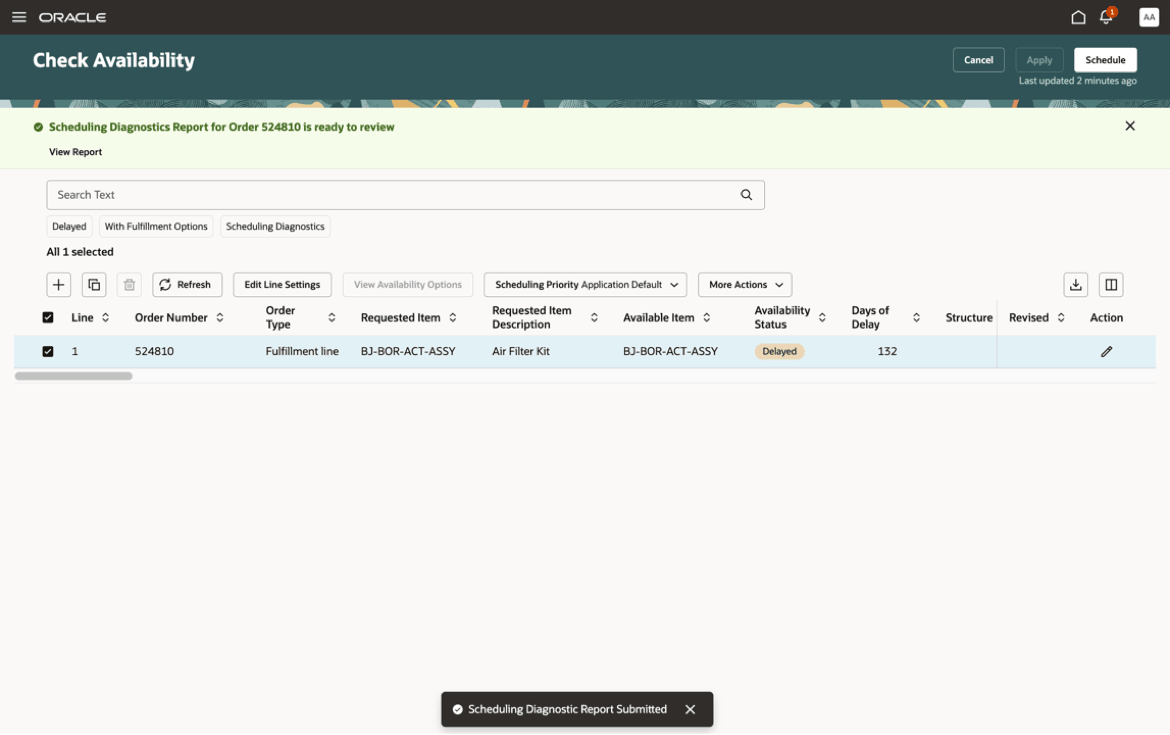
Message Indicating That the Scheduling Diagnostics Report Has Been Generated
Auto Schedule
As a prerequisite for capturing Scheduling Diagnostics during real-time promising, some setup steps need to be carried out. This involves enabling the tool and configuring filters to set the eligibility criteria on the Order Promising Options page.
You can enable Scheduling Diagnostics report generation by selecting the Scheduling Diagnostics checkbox.
You can add filter criteria by selecting one or more of the following order attributes:
- Requested Item
- Requested Ship-from Warehouse
- Customer Name
- Demand Class
- Requested Date
- Requested Quantity
Multiple selections for text-based attributes are supported.
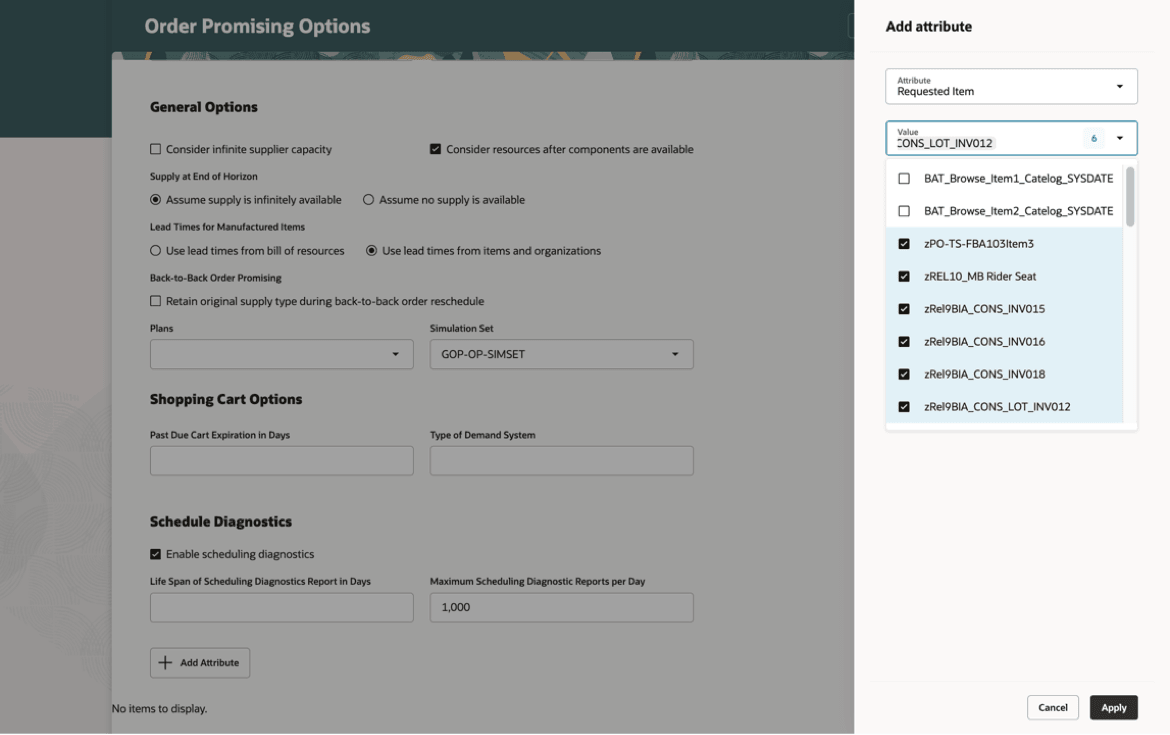
Multiple Selections for Text-Based Attributes
Different operators are supported for the Requested Date and Requested Quantity:
- Is
- On or Before
- On or After
- Between
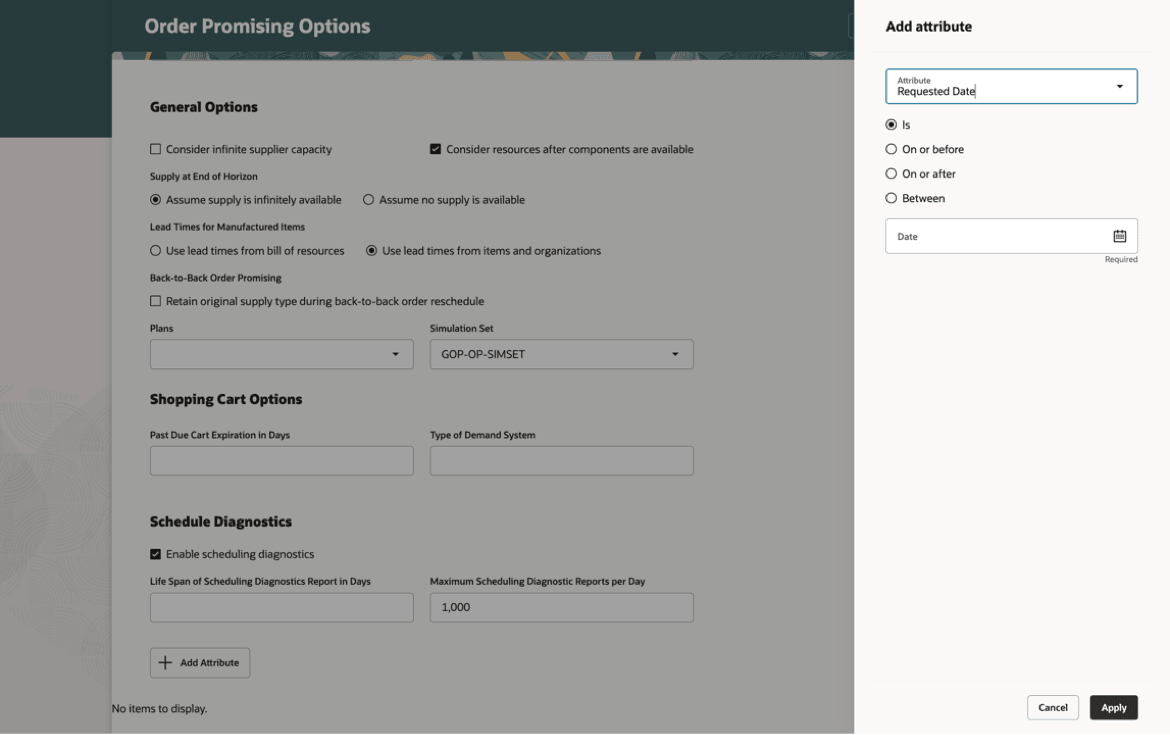
Operators Supported for Date Attributes
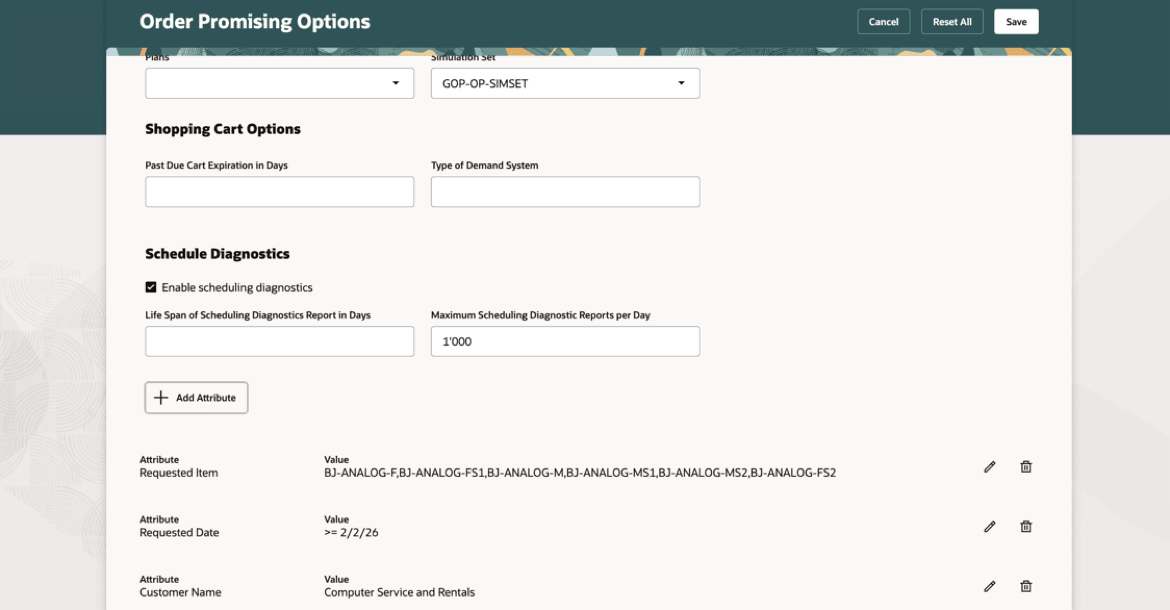
Multiple Attribute Selections
When orders are submitted, orders satisfying all criteria defined become eligible for scheduling diagnostics reporting.
If the Scheduling Diagnostics checkbox is selected, but no attributes are selected, then all orders scheduled in real-time become eligible for generating scheduling diagnostics information.
You can define the upper bounds for scheduling diagnostics report generation and retention on the Order Promising Options page. In the Maximum Scheduling Diagnostic Reports per Day field, enter the maximum number of reports to generate in a day. The default is 1000.
In the Life Span of Scheduling Diagnostics Report in Days field, enter the number of days to retain scheduling diagnostics reports. Reports beyond the specified number of days are purged. If no value is provided, the report is retained indefinitely.
Reviewing the Scheduling Diagnostics Report
To view the Scheduling Diagnostics report for the eligible order lines, select an order line in the Oracle Order Management UI, and select Check Availability. On the Check Availability page, select the order line, and then select Review Scheduling Diagnostics from the Actions menu. If the selected order line doesn’t have a corresponding report, then the Review Scheduling Diagnostics link isn’t enabled for selection.
Graphical View
The graphical view is displayed by default when you invoke the Scheduling Diagnostics report. The view depicts the search path followed while promising the order as a hierarchical series of nodes, with each node representing a step in the process.
There are three main views available to review the report:
- Complete Path: This is the most comprehensive display of the report, illustrating the various supply types (ATP, covering on hand and existing work, transfer, and purchase orders; new make supply; new transfer supply; and new buy supply) and resources that were searched by Global Order Promising when it was calculating the promise date. When you follow the tree in depth-first order (going along the top branch left to right as far as possible, then backtracking to the first unexplored branch and then follow it left to right as far as possible, then backtracking to the first unexplored branch, etc.) that will tell you the order in which Global Order Promising searched the supplies and resources.
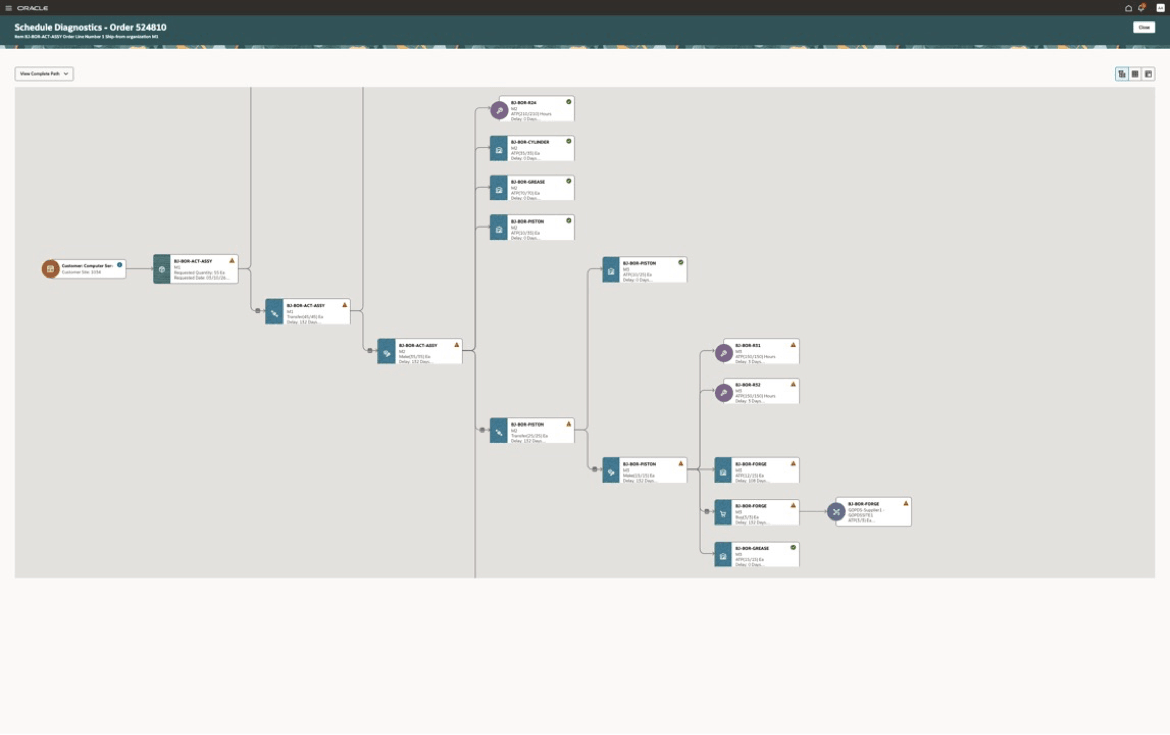
Complete Path in Scheduling Diagnostics Graphical View
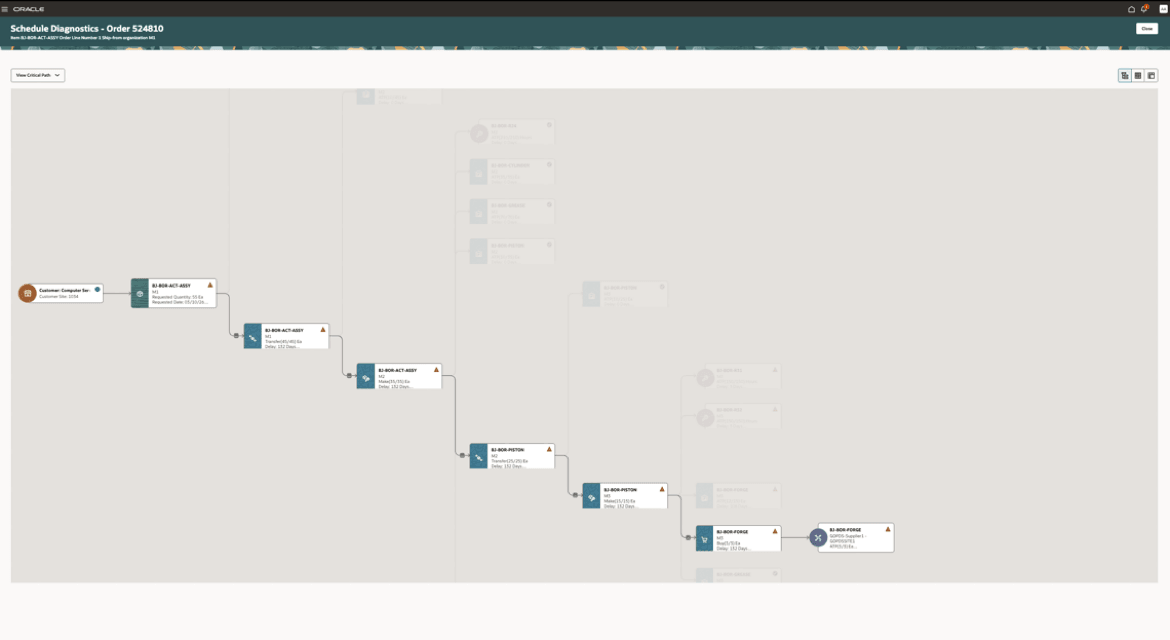
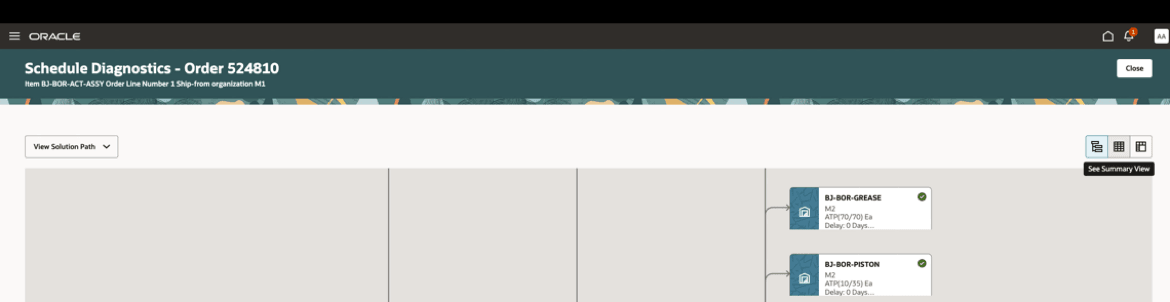
- Solution Path: This “grays out” from the Complete Path the nodes that Global Order Promising searched but then rejected, leaving only the nodes (supplies and resources) that were actually used to promise the order.
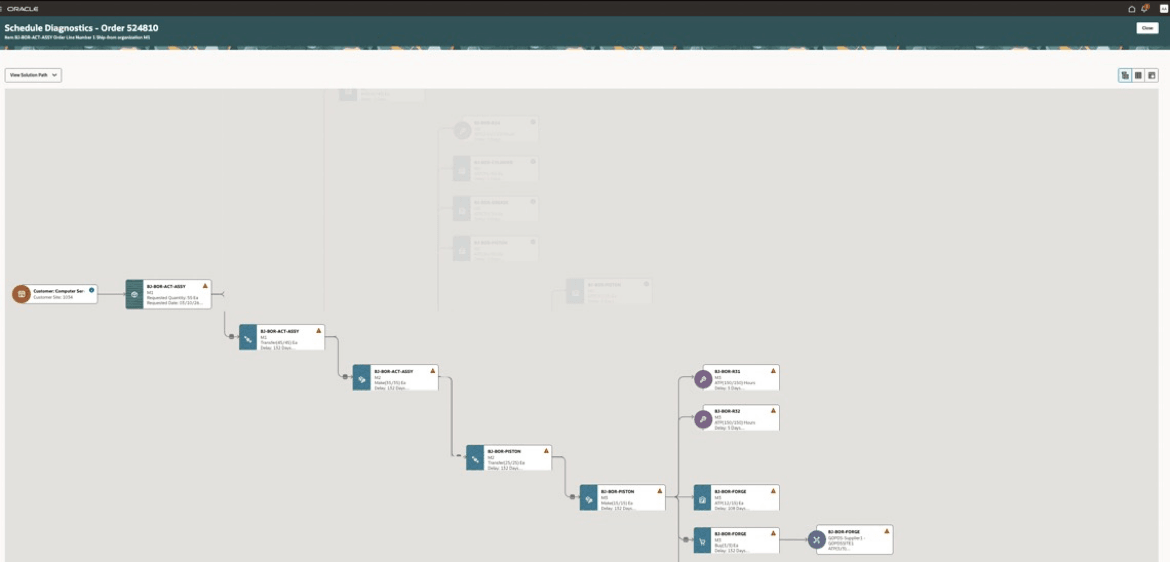
Solution Path in Scheduling Diagnostics Graphical View
- Critical Path: This display follows the most critical branch of the solution path that determined the promise date for the order and is best used to identify component or resource availability constraints that led to the order being delayed.
Critical Path in Scheduling Diagnostics Graphical View
Note: Based on the sourcing rules, ATP rule setups, and the conditions during order promising, the solution path might be depicted similarly to the complete path or the critical path. Each node has a contextual tooltip that's displayed when clicked to show relevant information pertaining to that node.
For example, for the buy supply node whose tooltip is shown below, you can see when Global Order Promising needed the supply and when it found it. If Global Order Promising finds supply later than expected, there may be a number of underlying reasons and the supplemental information in the tooltip is designed to help you track down those reasons:
- Global Order Promising isn’t considering an expected source of supply: Check the Sourcing Rule indicated in the tooltip.
- Global Order Promising isn’t considering an expected type of supply (for example, inbound purchase order): Check the ATP Rule indicated in the tooltip.
- Global Order Promising has run into the Infinite Time Fence: Check the Infinite Time Fence Date.
- The item’s lead times have been (inadvertently) set to be longer than appropriate: Check the lead time information in the tooltip.
- Calendar constraints have caused Global Order Promising to time the supply farther out into the future: Check the manufacturing, shipping, and receiving calendars indicated in the tooltip.
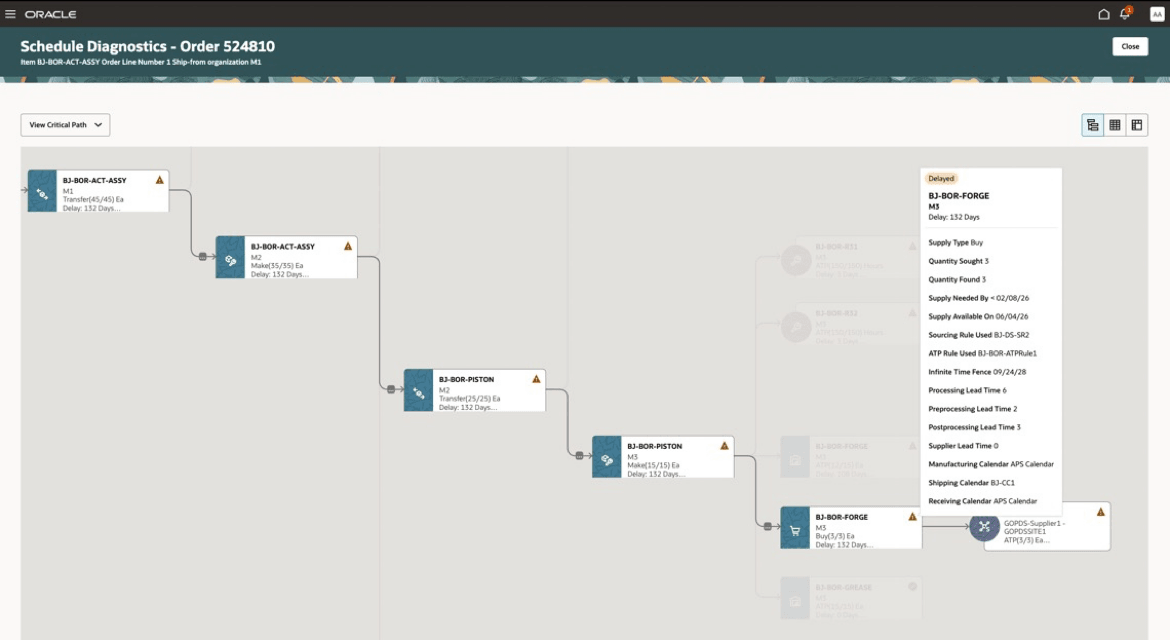
Tooltip Display in Scheduling Diagnostics Graphical View
Each node also enables switching to the summary or detailed tabular view, while highlighting the step corresponding to the selected node.
The graphical view offers the ability to focus on specific areas of the display to aid better analysis. From a given node, you can focus up to 2, 3, 4 or all levels upstream in the supply chain network. All other nodes that don’t fall into the selection are no longer displayed, allowing you to focus on a specific area of the solution.
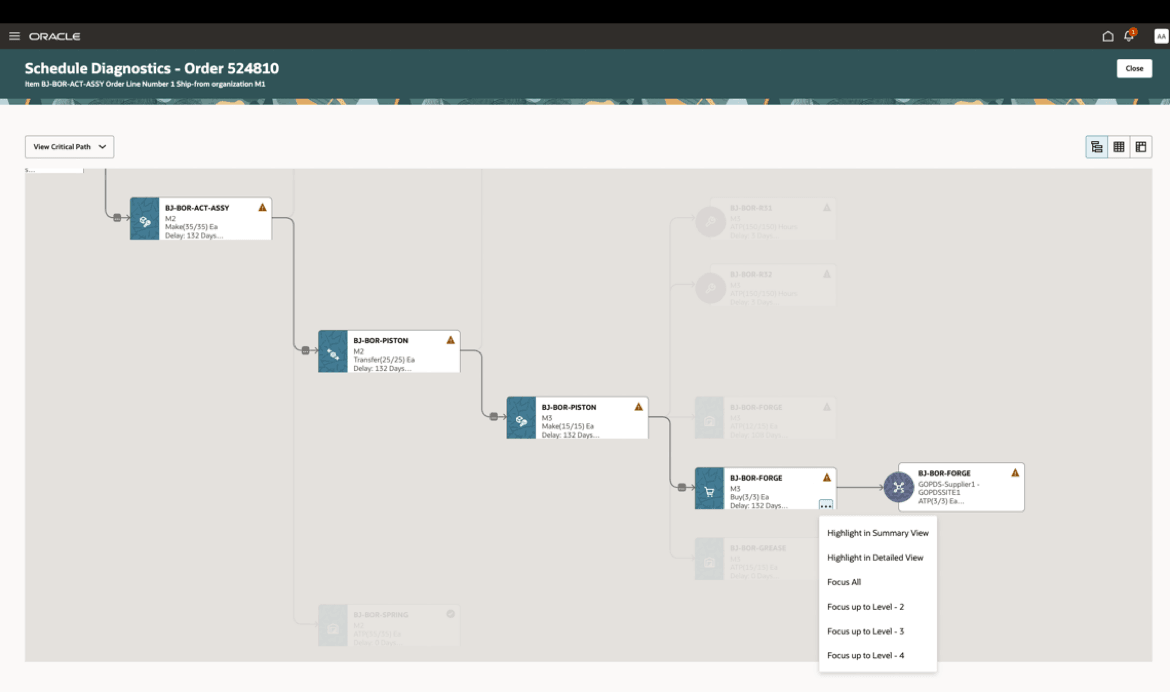
Focus and Navigation Switching Options in the Scheduling Diagnostics Graphical View
Summary View (Tabular)
The steps followed in the promising process are shown in a tabular form, with the activity and result detailed for each step. The table displays key information for every step, including Quantity Sought and Found, Date Needed and Found, Action performed, and Result returned.
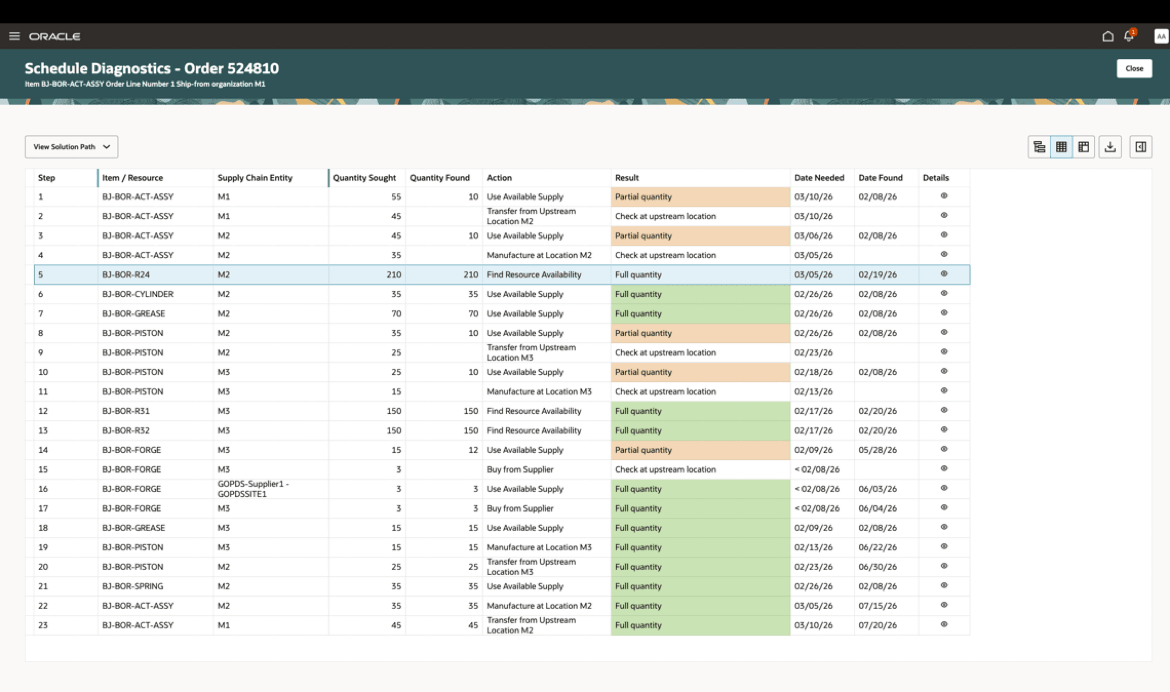
Summary Tabular View
Use the Details column to view additional information for a specific processing step.
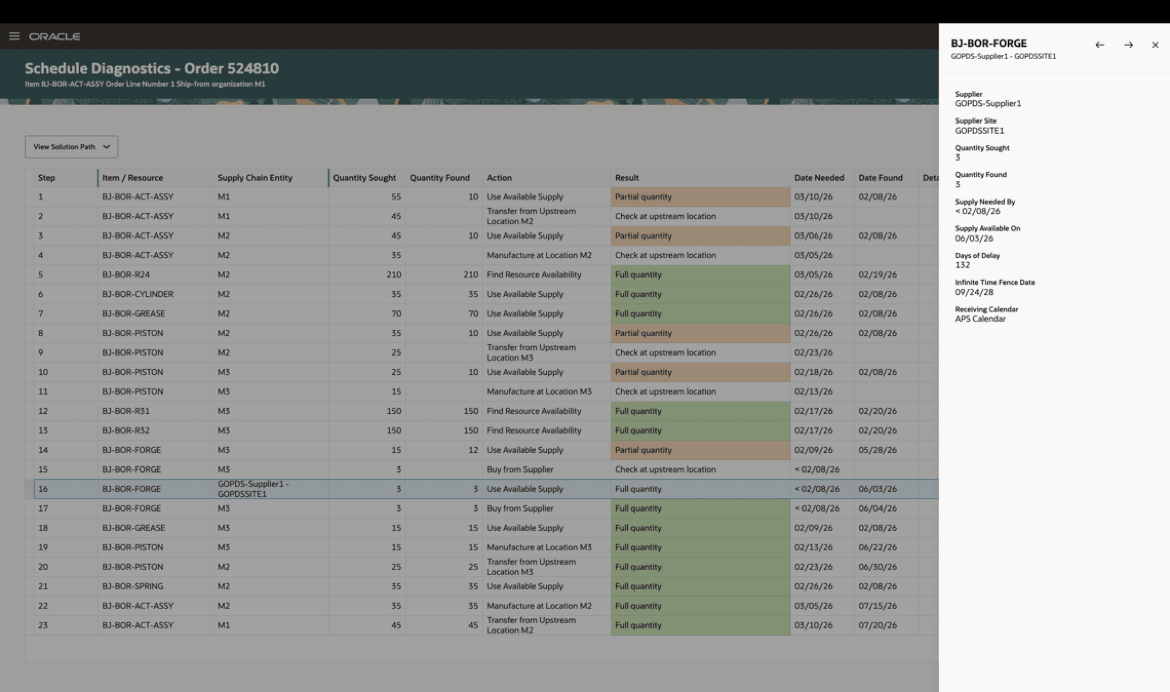
Details Pane in Summary Tabular View
You can use hide or show columns on this page by using the configuration icon at the right corner of the page.
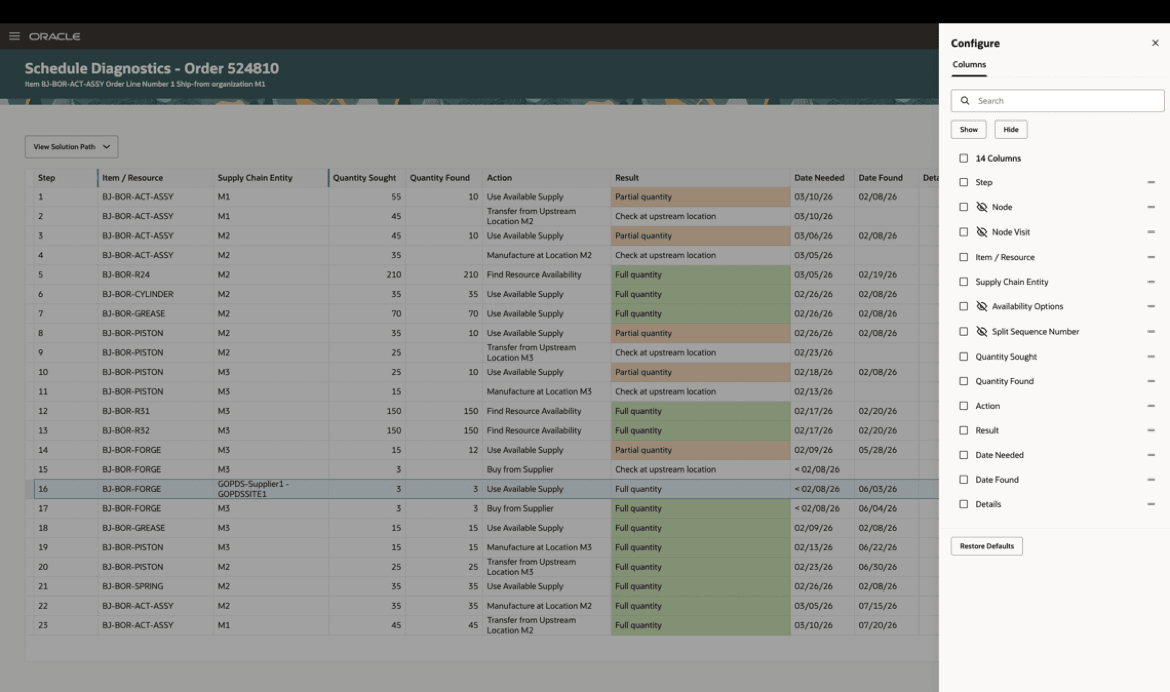
Column Selection in Summary Tabular View
You can also export of the report.
Detailed View (Tabular)
The detailed view shows the action performed, as well as the corresponding time-phased view of the supply/availability picture, quantity needed, quantity found, consumption, for each step of the process.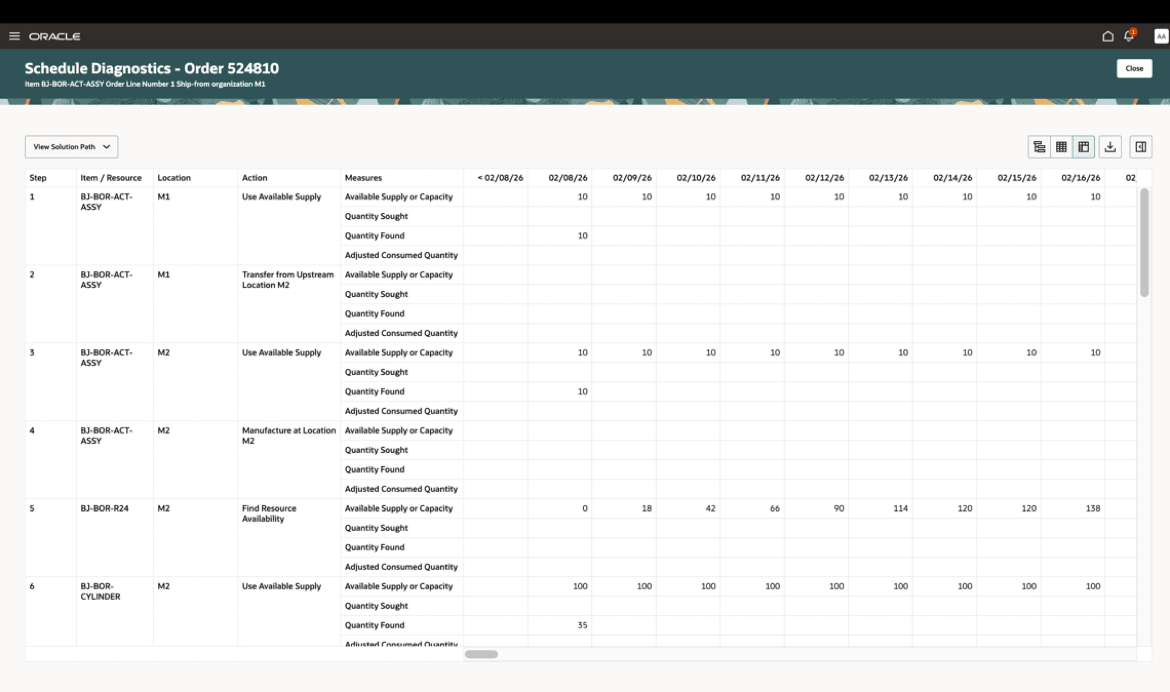
Detailed Tabular View
You can configure time buckets to display in daily, weekly, or monthly formats, and you can define the number of buckets with the configuration icon.
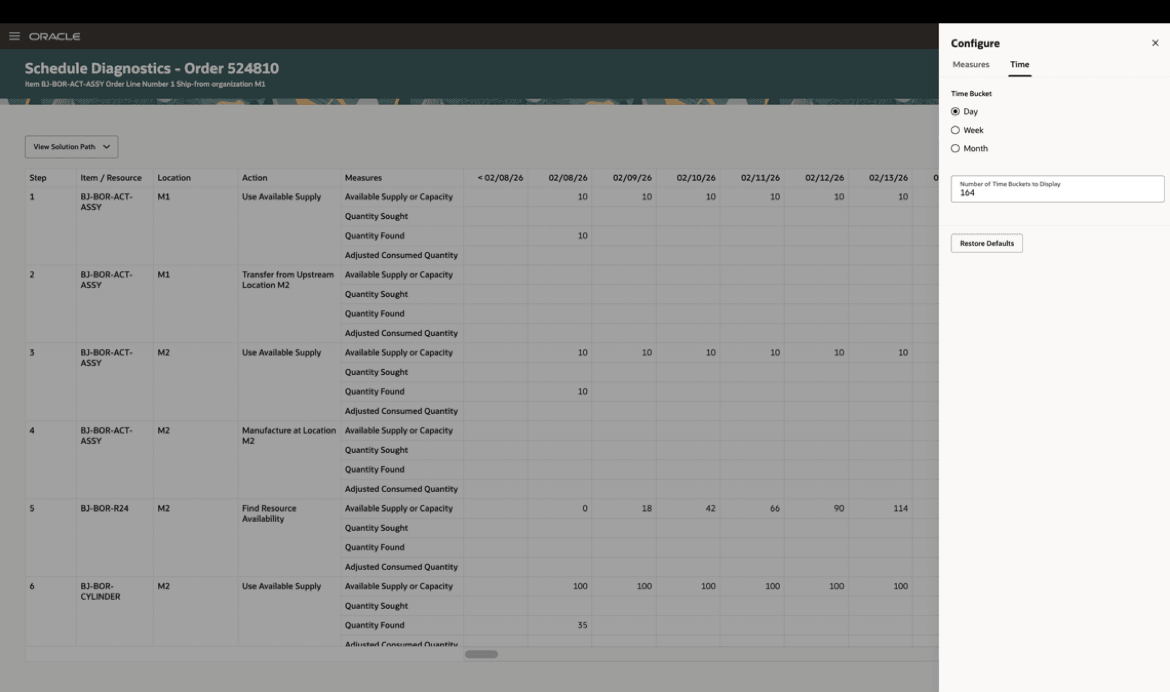
Display Time Bucket Configuration in Detailed Tabular View
You can also add additional columns, such as Quantity Sought, Quantity Found, Supply and Availability information, from the Measures tab in the Configuration pane.
Common Navigation
Action buttons at the top right corner of all scheduling diagnostics pages allow you to switch between views.
Report View Switching Buttons
Display actions for viewing the complete path, solution path, and critical path are available for all scheduling diagnostics pages.
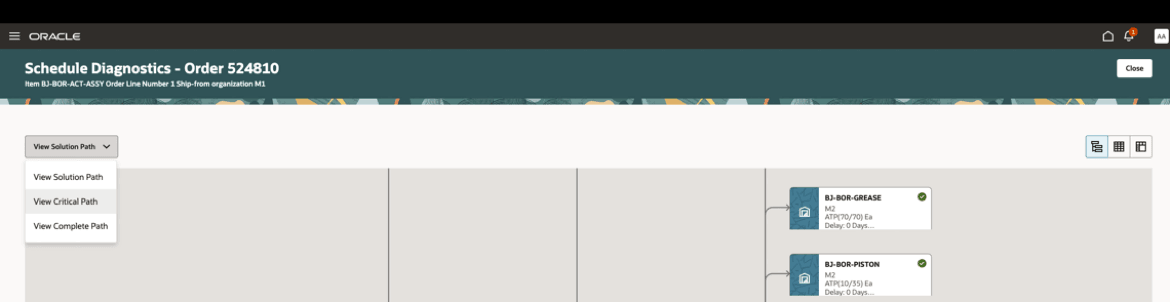
Supply Search Path Display Options
Example
Consider the example where an order is revisited through Check Availability. The order was placed for 20 each of the item. The unit of measure is user-defined as "Ea" (each), as shown below.
Check Availability executes with horizon start as the current date. The delay calculation is based on the Requested Date, and the supply picture is based on the current date.
The Check Availability result is reflected in the Scheduling Diagnostics tool as follows.
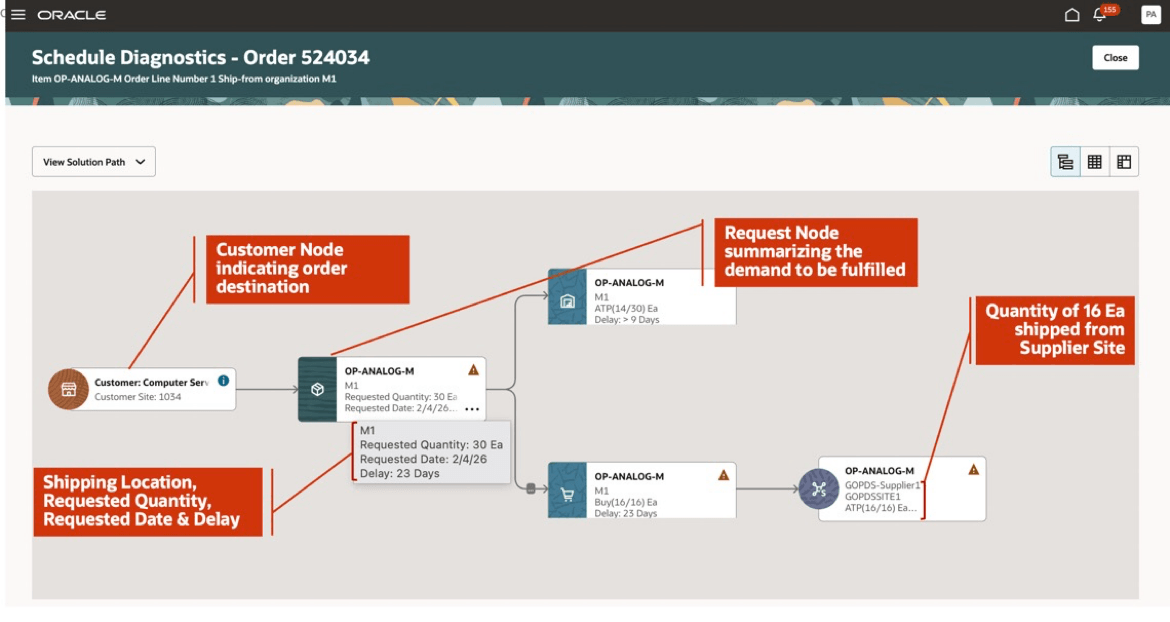
Graphical View of Solution Path
- Starting from the left-most node, you see that the demand line is for the Computer Services customer. This is referred to as the customer node. Moving to the right, you see that the demand line is for item OP-ANALOG-M, for a quantity of 30. The fulfillment organization is M1, and the requested date is February 4, 2026. This is referred to as the request node. Hovering the cursor over a node will show all details held in that node.
- Moving to the right, you encounter a branch in the tree. Whenever you encounter a branch, the proper way to read the tree is to progress to the uppermost unread branch and follow that to the very rightmost end of the tree. Reading the nodes of tree in this “depth-first” order reflects the exact order in which Global Order Promising considered each material supply or resource at each location in determining the promise date.
- The tree indicates that the next supply type that Global Order Promising looked at was “ATP” (on hand as well as scheduled receipts) of item OP-ANALOG-M at organization M1. It found 14 of the 30 required for the demand line. The delay shown as “> 9” days is relative to the requested date. The value implies in this scenario that the supply was needed on a past due date, and supply was available at the time. The supply continues to be available on the current date, which is 9 days past the requested date.
Global Order Promising therefore had to look for the remaining supply of 16. Following depth-first search order and backtracking to the first unexplored branch, you land on the node indicating a proposed buy order for item OP-ANALOG-M at organization M1 of quantity 16. This supply can only be procured with a delay beyond the requested date of 23 days. The final node in this branch tells us that the purchased supply is to come from supplier GOPDS-Supplier1.
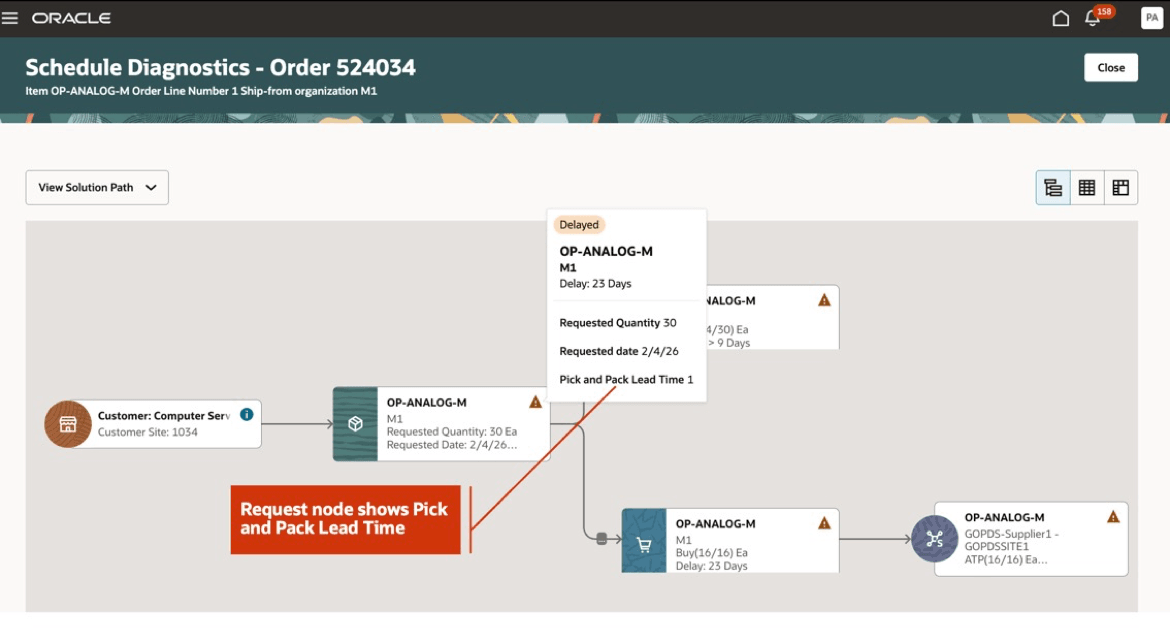
Request Node Details
Coming to the second node from the left, the Request Node, you can see a triangular icon at the top right corner, indicating a delay. Click on the icon to open the tooltip. From the tooltip, you see a summary of the results for the order, including item name, request date and quantity, overall days of delay in shipping the order. It also indicates that there’s a pick and pack lead time of 1 day defined.
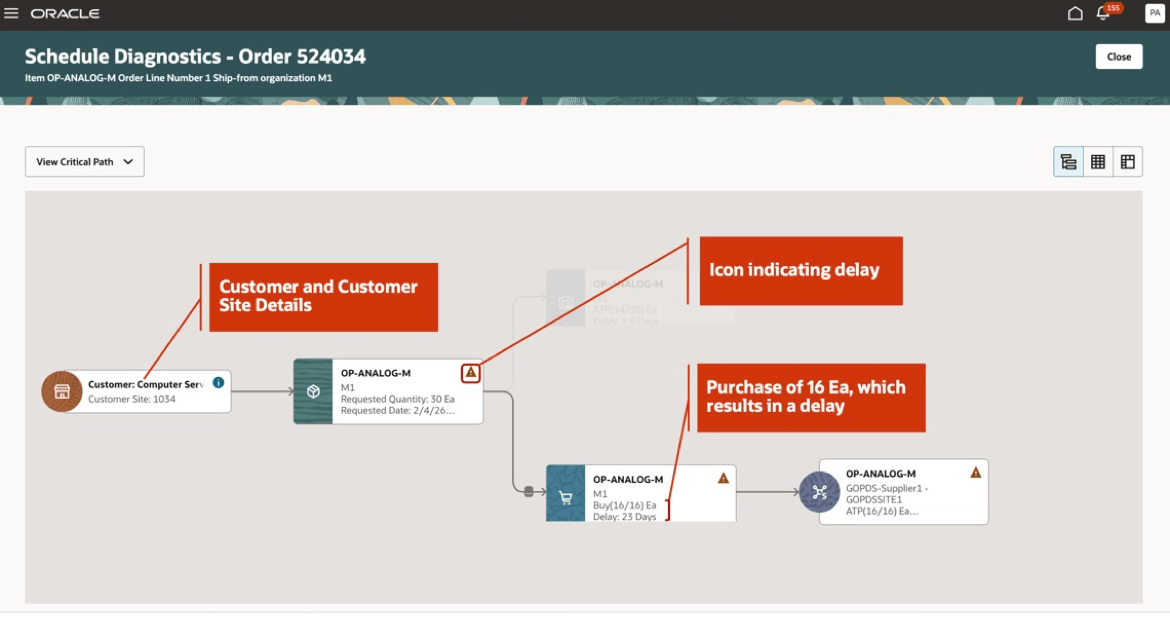
Critical Path Showing Delay
Selecting the Critical Path option from the drop-down list at the top left of the page, you see that the branch with one node, which didn’t contribute to the overall delay of the order, is grayed out. This tells us that the delay was caused by the branch where the supply of 16 each was purchased from the supplier.
Next, you navigate to the summary tabular view to review the steps.
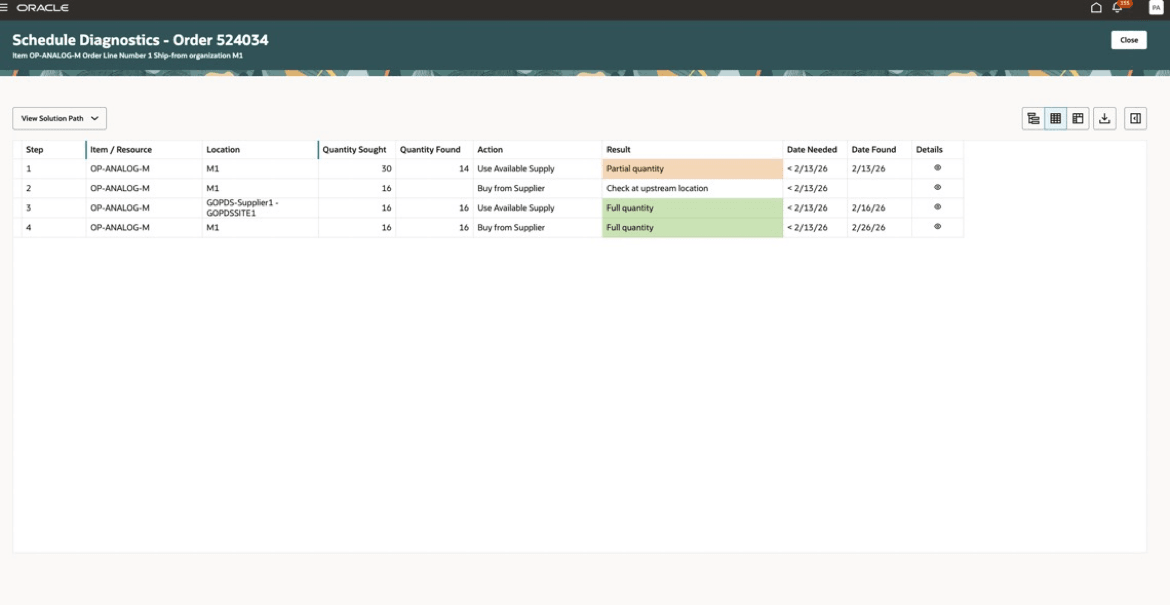
Summary Tabular View for Solution Path
The Summary View also supports complete path, solution path and critical path depictions. After selecting the solution path, all steps involved in the optimal solution are displayed. You can see that there are four steps involved in this path.
After reviewing the table from left to right, you see each step having the item details, followed by the location where the step occurs, the quantity involved (quantity sought and quantity found) in each step. The action performed by the solver in each step is detailed in the next column, followed by the result of the action. The result column is color coded to indicate success (green), failure (red), or partial success (beige). Next, you see the date when the quantity was needed and when the quantity was found. Since the requested date is past due, for steps with calculated dates in the past, the display shows “< current date”. The Details column has an icon for each step, which will invoke a panel displaying the calendar, lead time, and other relevant information.
In step 1, you see that total quantity of 30 each is needed at organization M1, and a partial quantity of 14 each was found on the current date. In step 2, the sourcing of the remaining 16 units of supply from the supplier is initiated at organization M1. In step 3, 16 units of supply are sought from the supplier, and found to be available on February 16. In the fourth and final step, the supply is purchased, to arrive at organization M1 on February 26.
With Requested Date = February 4 and Supply Found Date = February 26, and 1 day of Pick and Pack Lead Time you can see that 23 days of delay are accounted for.
To view the critical path, you switch to the Summary View.
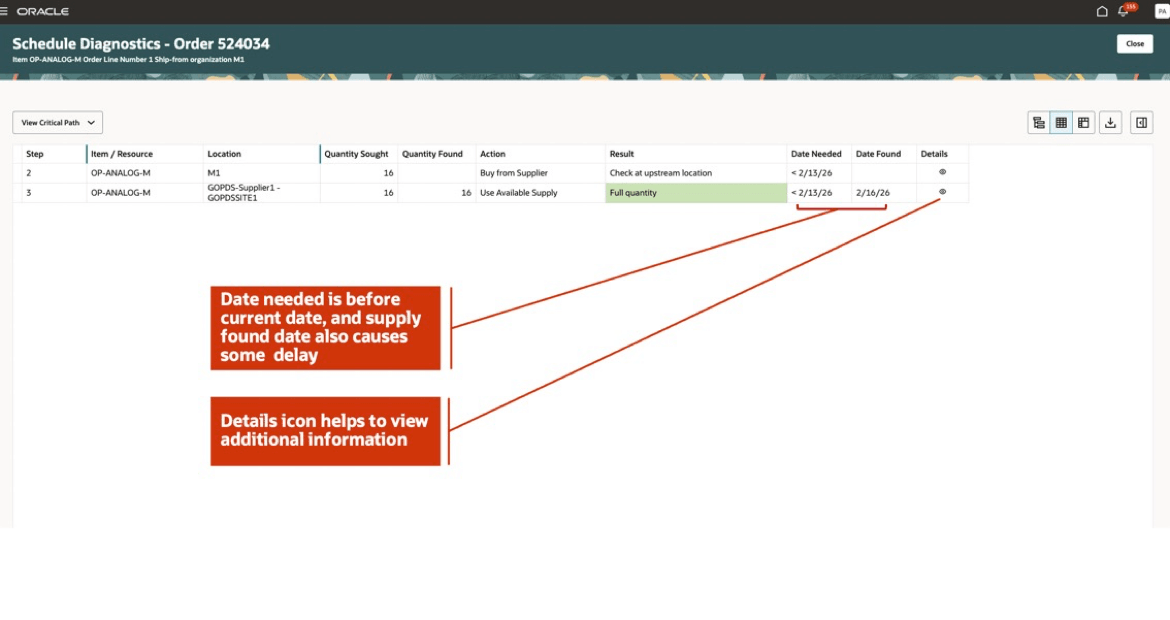
Summary Tabular View for Critical Path
You now see that only steps involving purchase of supply from the supplier included in the critical path. To understand more, you click on the Details icon for the step where supply is sought from the supplier, from organization M1.
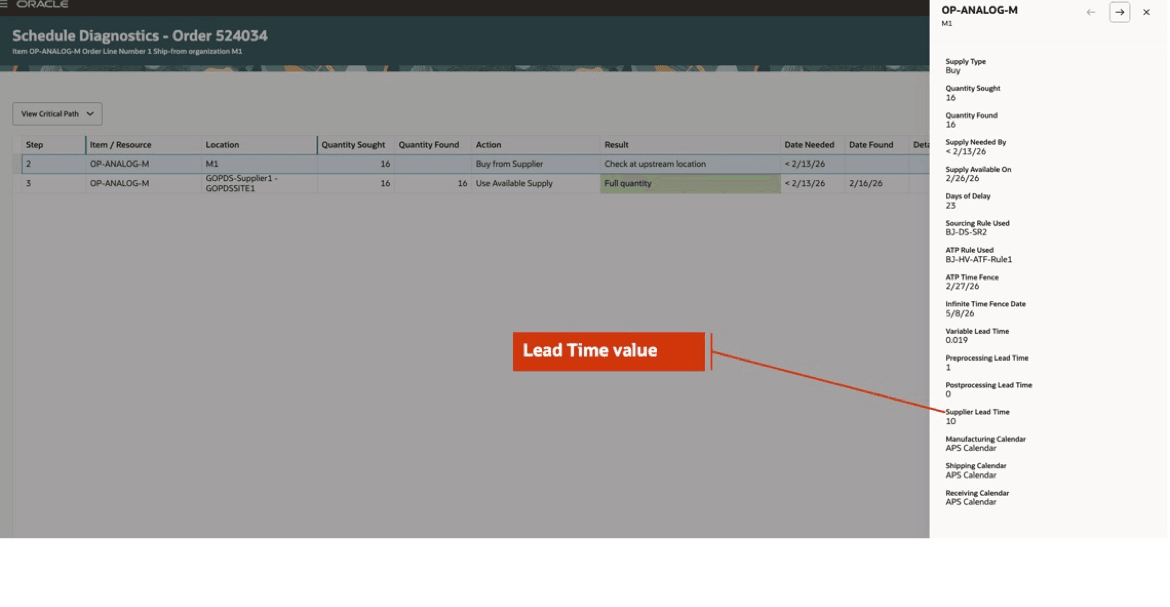
Details View
There’s a Supplier Lead Time value indicating that there will be an offset of 10 days to the day supply will be shipped from the supplier location to the organization M1.
This pane also displays additional relevant information such as Supply Type (Buy in this case), Quantity Sought and Found, Supply Need by Date (based on past due requested date), Supply Availability Date (February 26), Days of Delay from requested date (23 days), Sourcing Rule applied for supply recommendation, ATP rule applicable for the item, the different lead times like Pre-Processing Lead Time (1 day), Post-Processing Lead Time, various calendars like organization calendar, shipping calendar, receiving calendar. This gives you a holistic picture of the parameters and settings that the solver took into consideration during promising.
Coming back to the critical path, it’s clear that the supplier lead time contributed to delaying the order. However, given that the current date is 9 days past the requested date, and adding 10 days of supplier lead time, as well as 1 day of pick and pack lead time, you have 20 days of delay in total. This doesn’t completely cover the overall delay of 23 days seen on the order.
To analyze further, you navigate to the detailed tabular view to review the availability picture at the supplier location.
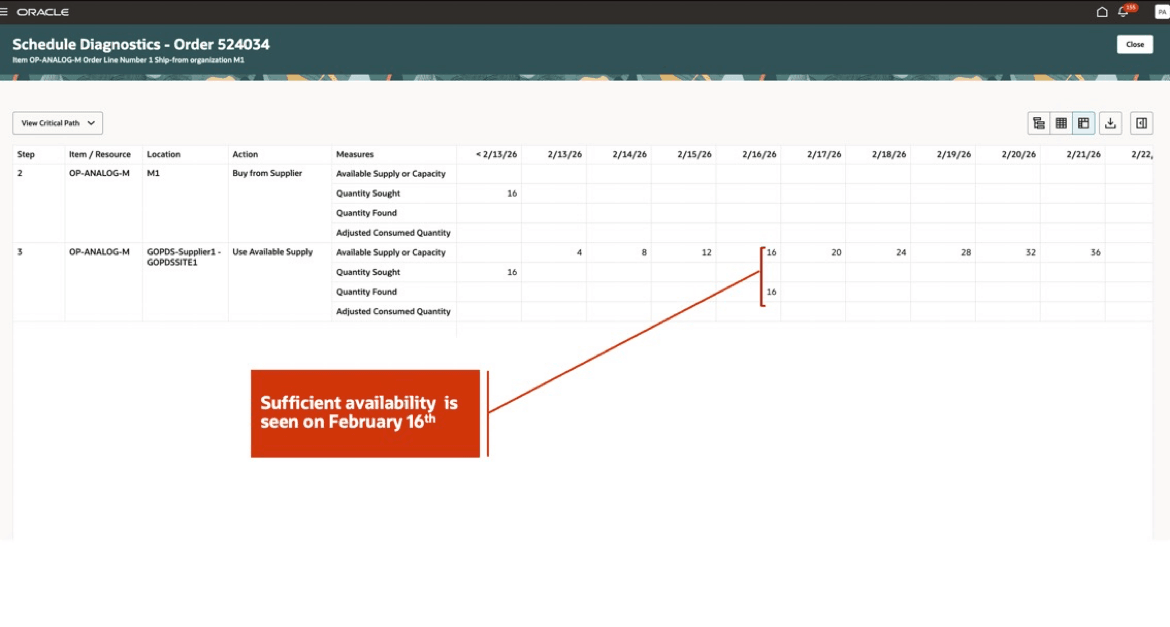
Detailed Tabular View Showing Supply Availability Constraints
Here you see that the availability is constrained from February 13 through February 16. This adds 3 more days to the overall delay.
From this, you conclude that the delay of 23 days was caused due to the following factors:
- Requested Date is past due by 9 days.
- Supplier availability is constrained from current date (February 13) through February 16 (3 days).
- Supplier Lead Time is 10 days from the day supplier availability.
- Pick and Pack Lead Time of 1 day is defined between the date the supply is available to when it ships from organization M1.
This concludes the example, where you explored how, with the help of the various views provided in Scheduling Diagnostics, you can analyze results to identify critical areas of your supply chain network and identify the root cause of delay.
Steps to enable and configure
You don't need to do anything to enable this feature.
Tips and considerations
- Scheduling diagnostics can be invoked on demand for an order while running Check Availability from Oracle Order Management, or it can be automatically calculated for qualified orders during regular order submission (Auto Schedule) and then later viewed.
- For real-time promising, if the Scheduling Diagnostics checkbox is selected, but no attributes are selected, then all orders scheduled in real-time are considered eligible. This could impact performance.
- Only one scheduling diagnostics report is generated for each order line. The latest report generated for the order line will be retained.
- After the number of Scheduling Diagnostics reports generated per day exceeds the defined upper limit on the Order Promising Options page, the report will no longer be automatically generated for that day during real-time order promising.
- Scheduling Diagnostics information for orders will be automatically deleted after they exceed the number of days’ retention upper limit defined on the Order Promising Options page. If no value is provided, the report is retained indefinitely in the current release.
- Scheduling Diagnostics can be invoked for one order line at a time.
- Scheduling Diagnostics generation isn’t supported for orders that have supply allocations.
- Scheduling Diagnostics generation isn’t supported for collected reserved orders.
- Scheduling Diagnostics generation isn’t supported for orders that have Configure-to-Order items (Assemble-to-Order, Pick-to-Order Models, and Pick-to-Order Kits).
- Scheduling Diagnostics generation isn’t supported for orders that are promised using the source-based promising solution.
Key resources
See also the Backlog Management Scheduling Diagnostics feature.
Access requirements
Users who are assigned a configured job role that contains these privileges can access this feature:
- View Supply Allocation Report (MSP_VIEW_SUPPLY_ALLOCATION_REPORT_PRIV)
This privilege was available prior to this update.