Redwood: Manage Order Promising Demands from External Source Systems
You can use the Redwood user experience to manage order promising for sales order lines collected from an order management system. Use search criteria to filter and select order lines, then prioritize and schedule them in required sequence. You can also review key details for selected order lines, including item availability, supply availability, allocation information, and scheduling diagnosis reports. In addition, the page provides streamlined access to common setup and configuration tasks.
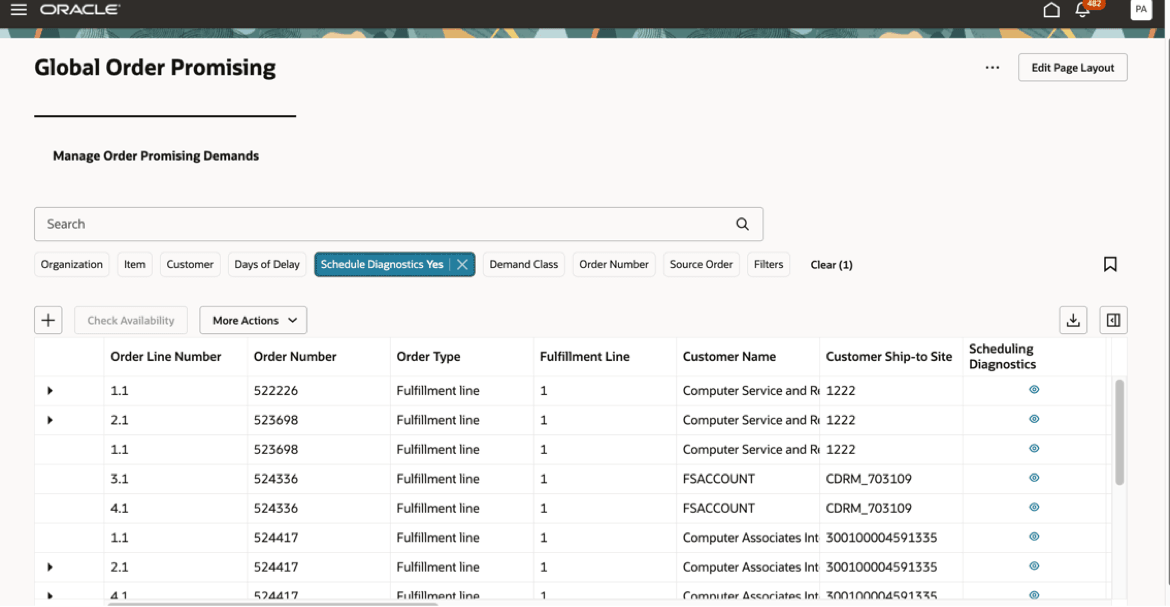
The Manage Order Promising Demands (MOPD) page offers the ability to search, and view promised and collected sales orders, perform Check Availability simulations, review various Planning and Oracle Global Order Promising configurations and setups, and access Scheduling Diagnostics information in a new Redwood user experience.
View Collected Sales Orders
You can view sales orders that are either loaded from an external source system through the file upload process or collected directly from a Fusion source system.
You can search for orders using the following filter criteria:
- Organization
- Item
- Customer
- Days of Delay
- Scheduling Diagnostics
- Demand Class
- Order Number
- Source Order
From the Actions menu for the selected item, you can access the following reports:
- Supply Availability Report
- Item Availability Report
- Supply Allocation Report
Check Availability and Order Simulations
You can select one or more orders from MOPD and click Check Availability in the Actions area. This opens the Check Availability Redwood page, where you can perform related tasks such as scheduling priorities, reviewing reports, creating simulation demands, editing line settings, and rescheduling orders.
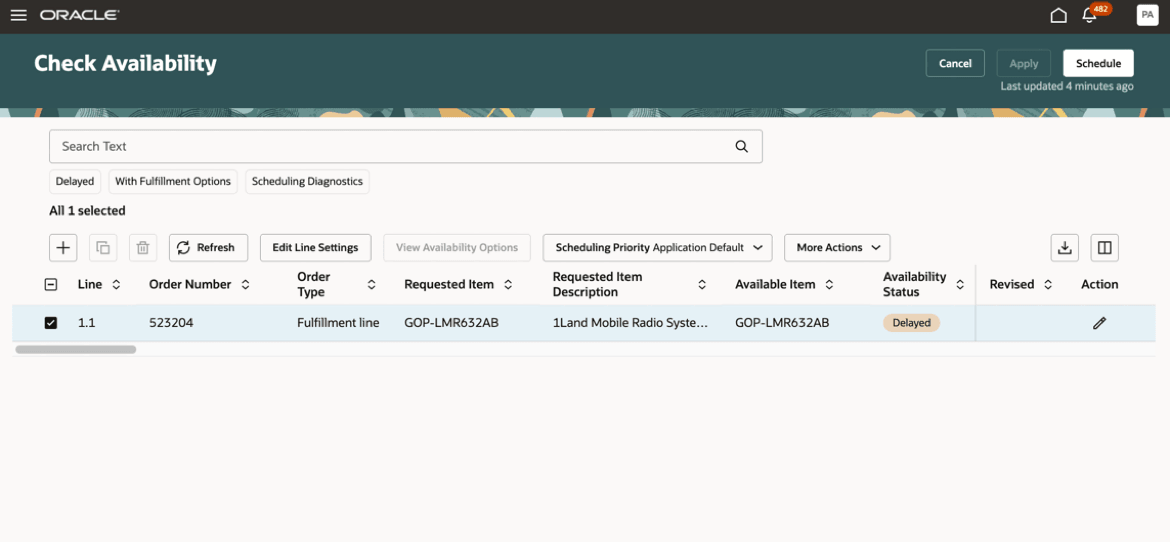
Check Availability Page
The MOPD page also provides direct access to simulation demand creation. Click the Add icon to open the New Simulation Demand panel drawer in the Check Availability page:
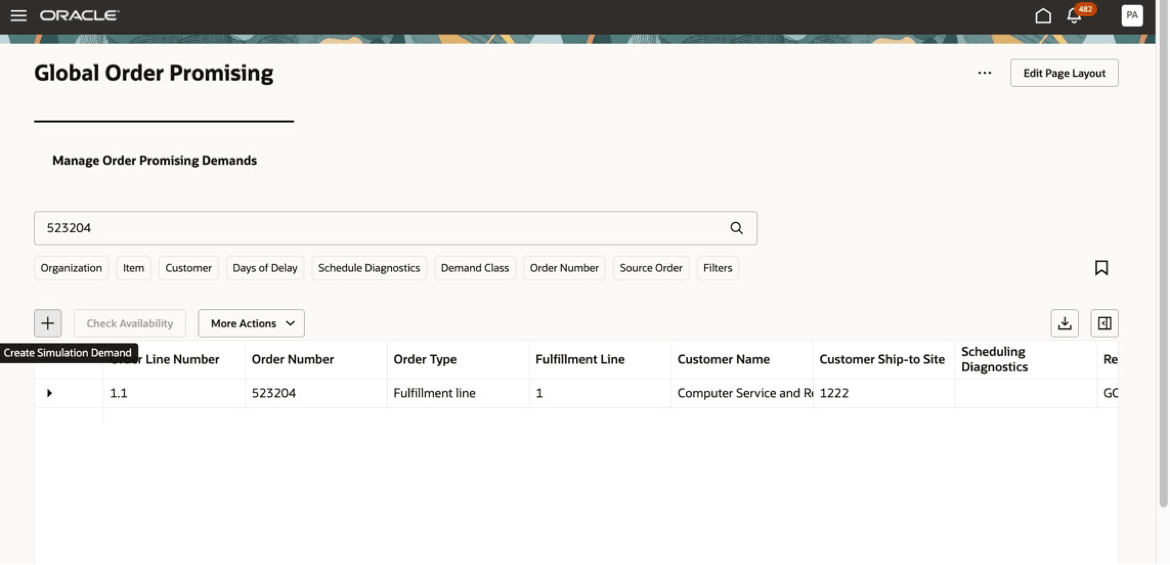
Simulation Demand Creation from MOPD page
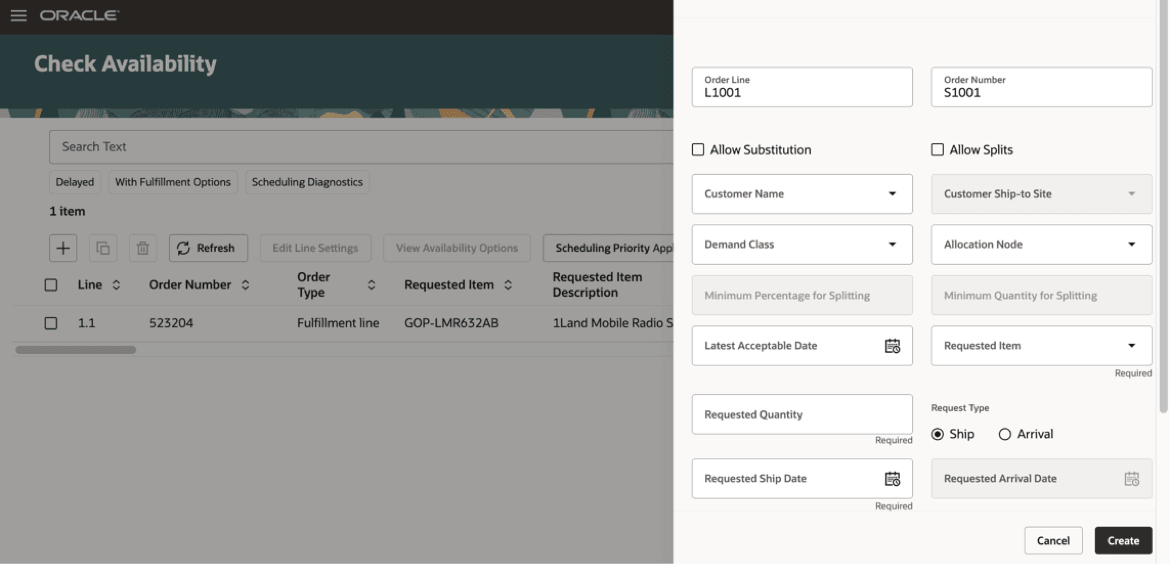
New Simulation Demand Panel Drawer
Configurations and Setups
From MOPD page, you can access common configurations and setups, including Collect Planning Data, Maintain Supply Network Model, Order Promising Options, ATP Rules, Sourcing Rules, Assignment Sets, and so on.
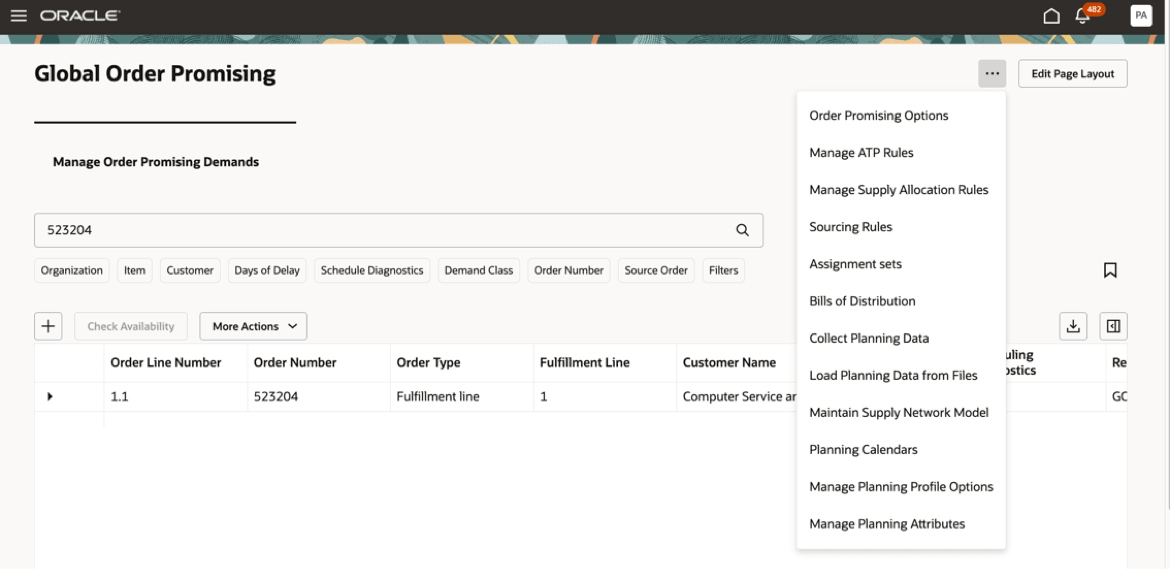
Configurations and Setups
Scheduling Diagnostics
Use the Scheduling Diagnostics filter chip to identify orders for which Scheduling Diagnostics was enabled during routine promising and to review the report directly from the MOPD page.
Scheduling Diagnostics Filter Chip
To access the report, click the icon in the Scheduling Diagnostics column. This opens the Scheduling Diagnostics report for that order. Note that the report reflects the information captured at the time of order promising, including the supply and demand picture that existed at that point in time.
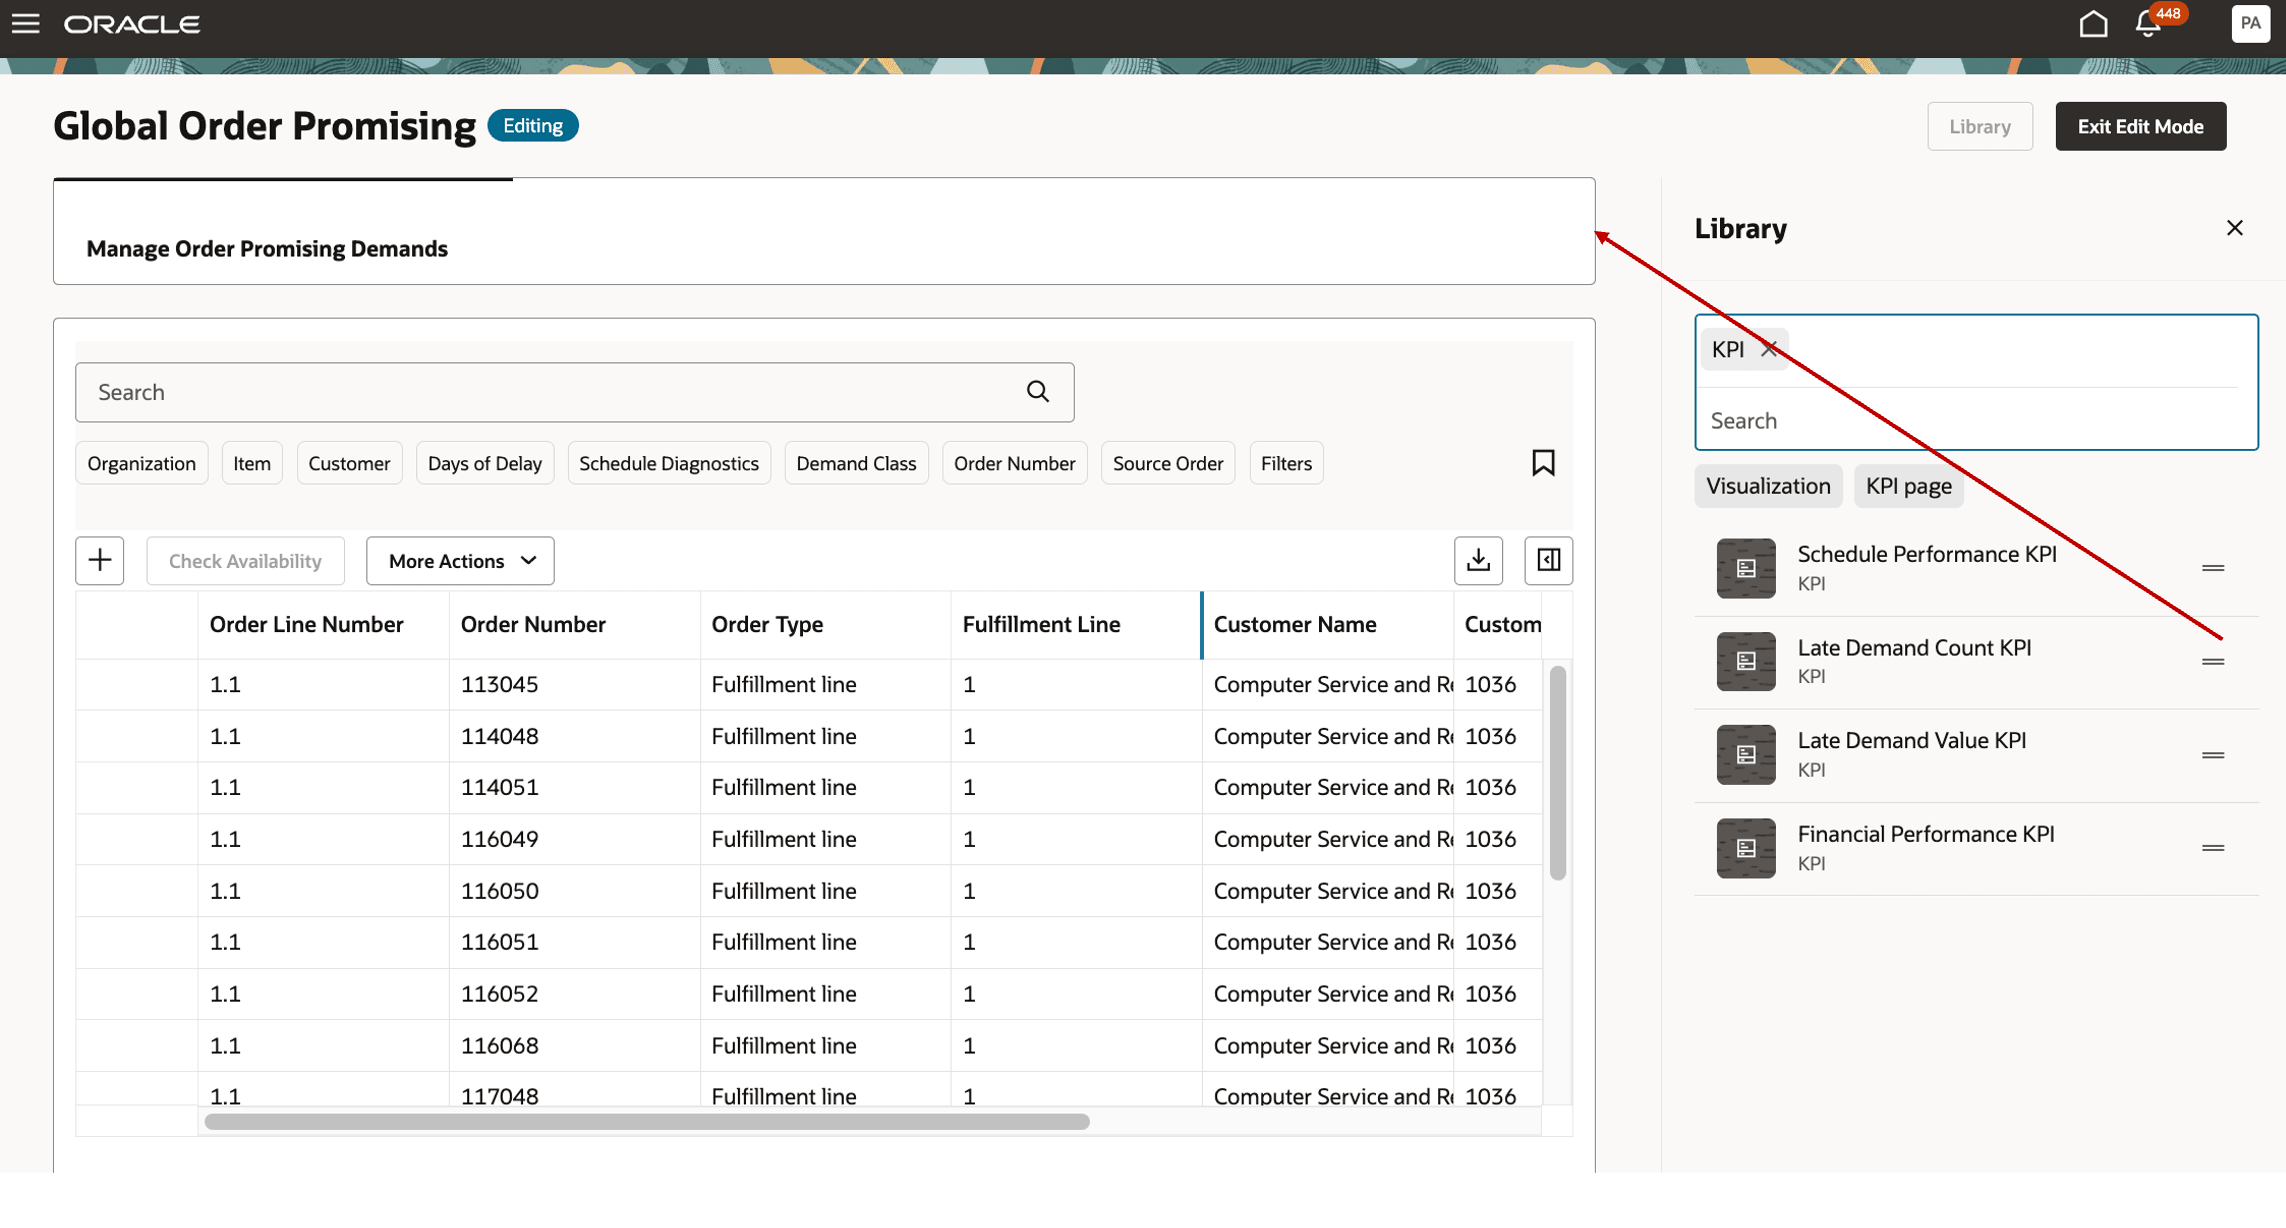
Analytics
Click Edit Page Layout to select KPIs and analytics. These are organized as follows:
Analytics and KPIs
| KPI | Analytics | Comments |
|---|---|---|
| Late Demand Value |
|
The analytics display the value of only the late demands broken down by Category, Shipping Organization, Customer and Time. |
| Late Demand Count |
|
The Demand Line Scheduling distribution analytic shows the distribution of the on-time and delayed orders across all the scheduled orders, grouped by days of delay ranges.
|
| Schedule Performance |
|
Displays the scheduling performance of the order promising process by highlighting the number of orders promised on-time and late. |
| Financial Performance |
|
The margin analytic displays the overall margin percentage across all scheduled orders, calculated as (Revenue – Fulfillment Cost)/(Fulfillment Cost), aggregated across all orders. The Revenue and Fulfillment Cost analytic displays the Revenue and Fulfillment Cost associated with lines scheduled, aggregated by week. |
To add analytics, follow these steps:
- Click Edit Page Layout
- Select a KPI, click and drag it to the tab area to create a new tab. You can create multiple KPI tabs this way.
Click and Drag KPI to Create a New Tab
Note that all the graphs associated with a KPI will be displayed by default. You can choose to select and remove any graph from the page.
To add a graph to its KPI page, click and drag the analytic.
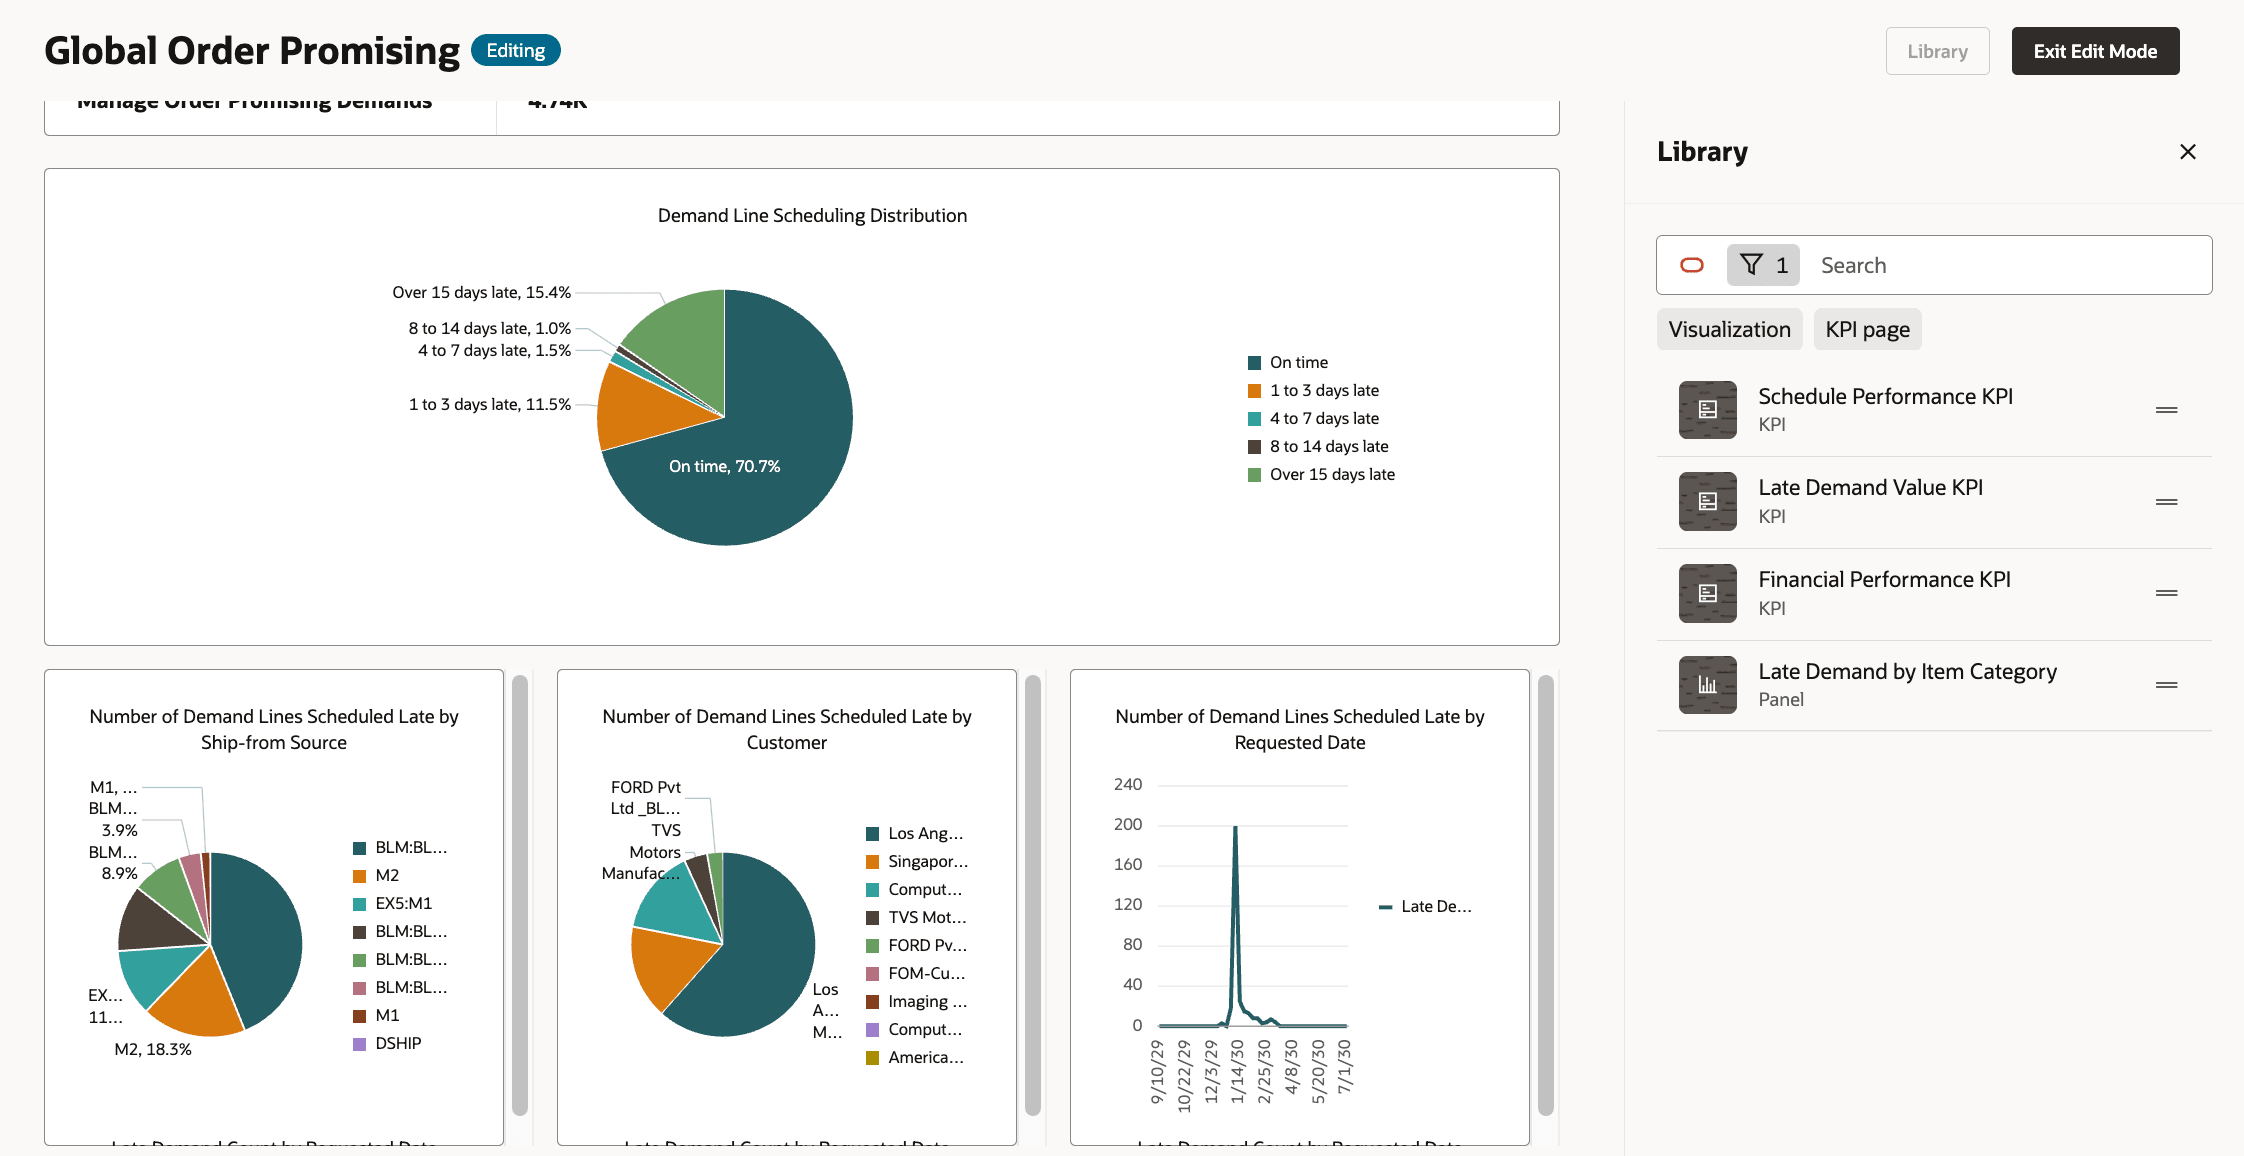
KPI Tab Displaying Analytics
Steps to enable and configure
You don't need to do anything to enable this feature.
Tips and considerations
- The MOPD page can be accessed using the following navigation paths:
- In the Order Management group, select the Global Order Promising (New) icon.
- In the Order Management group, navigate to the Quick Actions area and select Show More > Global Order Promising.
- Global Order Promising does not support cross-instance promising. Orders loaded from a given source system can be promised only by organizations within that source system.
- Graphs and analytics provide seeded measures, which are not customizable.
Access requirements
Users who are assigned a configured job role that contains these privileges can access this feature:
- View Planning Supply Availability (MSP_VIEW_PLANNING_SUPPLY_AVAILABILITY_PRIV)
- Schedule Fulfillment Line (MSP_SCHEDULE_ORCHESTRATION_ORDER_FULFILLMENT_LINE_PRIV)
These privileges were available prior to this update.