Redwood: Manage Analysis Sets Using a New User Experience
You can now create, edit, delete, and apply analysis sets from the Visualizations and Analysis Sets page in Redwood. Analysis sets let you save commonly used measures and members and apply them to tables and graphs or use them as focused data views without creating filters. You can also use analysis sets as filters on forecasting profiles to limit their scope to subsets of members. The changes made to analysis sets don’t affect visualizations where they were previously applied, and stable analysis is ensured.
In the Redwood work area named Supply Chain Planning, on the More Actions menu for a demand, demand and supply, replenishment, sales and operations, or supply plan, select View More, and in the Actions drawer, in Pages and Visualizations, select Visualizations and Analysis Sets.
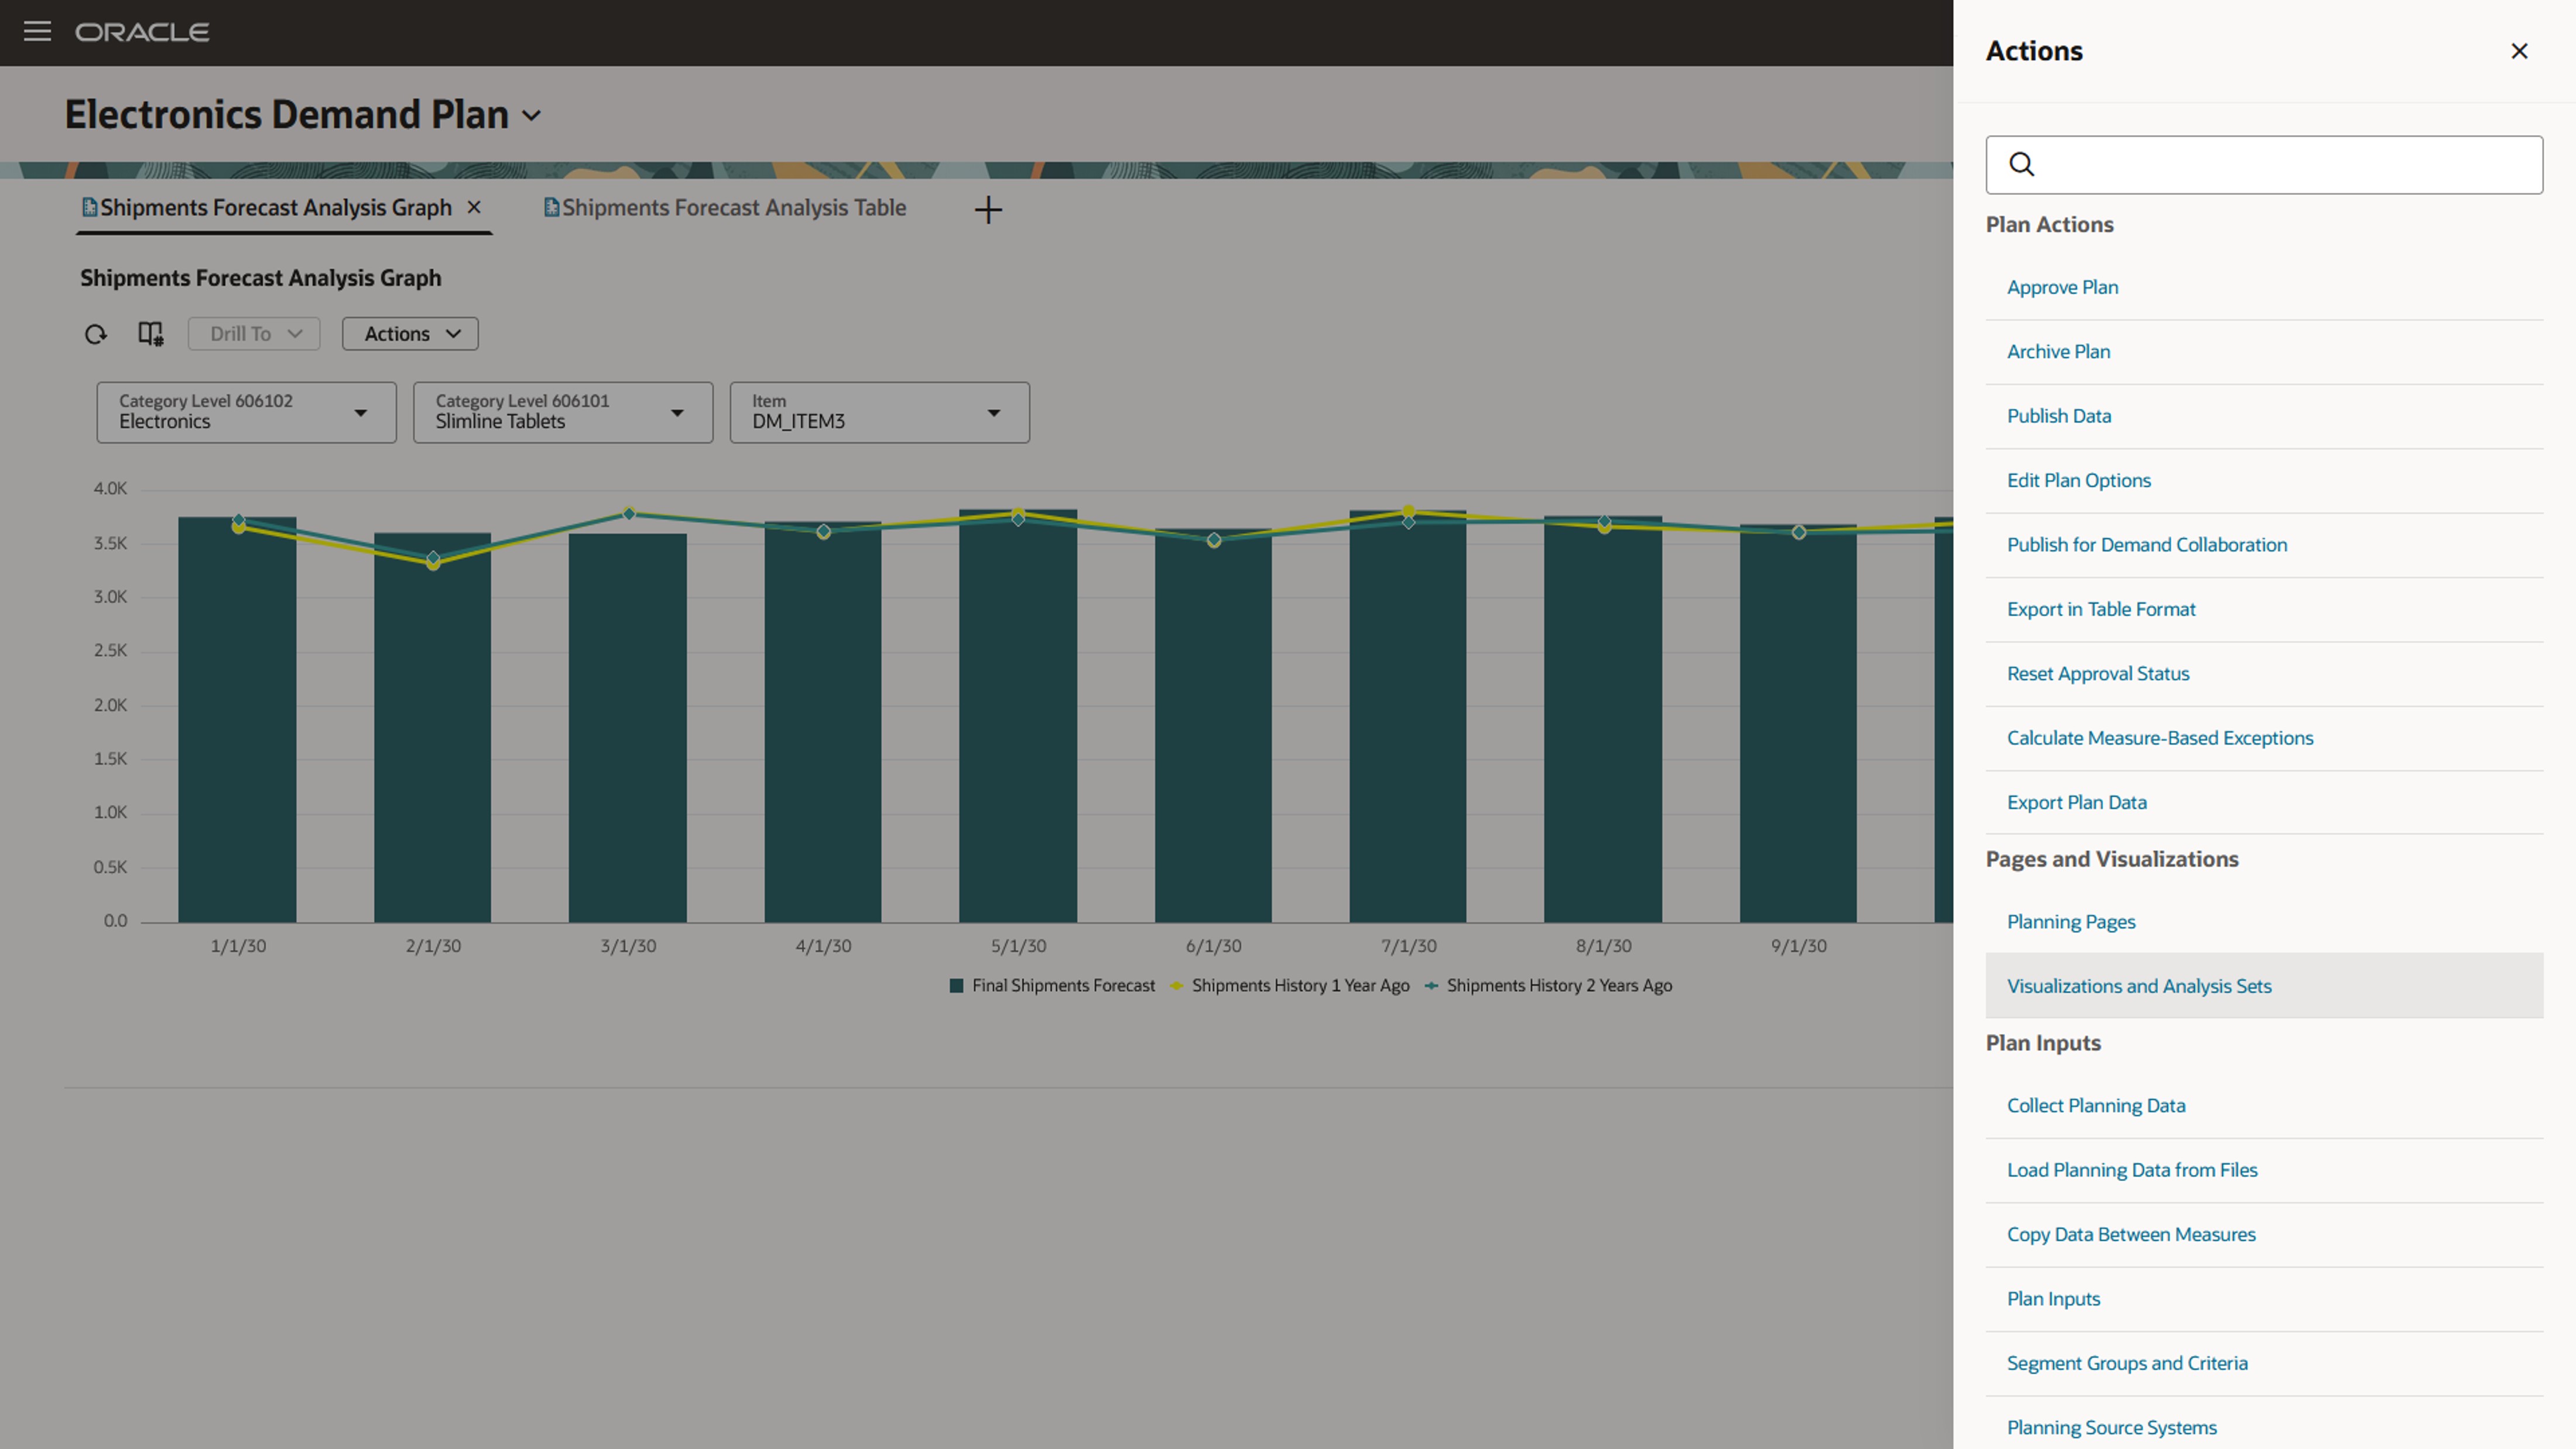
Menu Item Named Visualizations and Analysis Sets
The Visualizations and Analysis Sets page will open on a new tab in your browser and display visualizations and analysis sets. You can use the Type suggested filter to show only analysis sets.
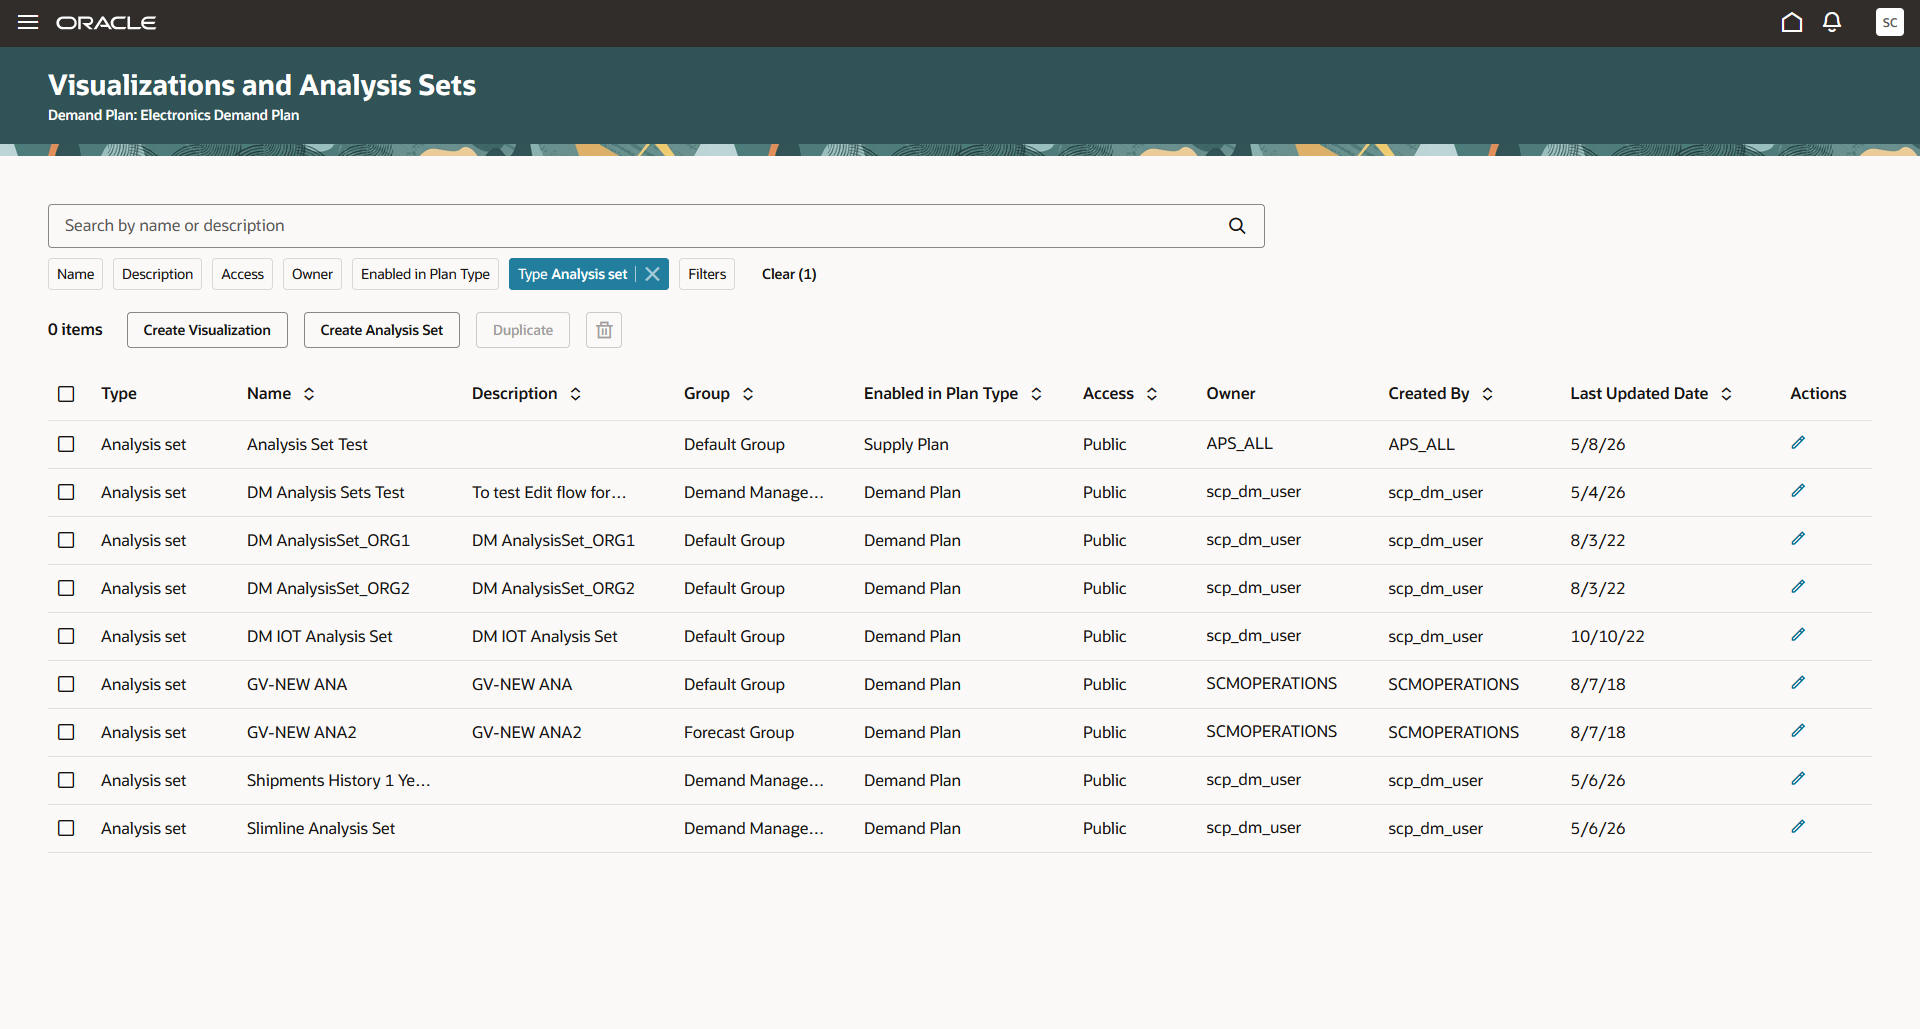
Page Named Visualizations and Analysis Sets
Creating an Analysis Set
To create an analysis set, follow these steps:
- On the Visualizations and Analysis Sets page, select the Create Analysis Set button on the toolbar.
A guided process drawer will open.
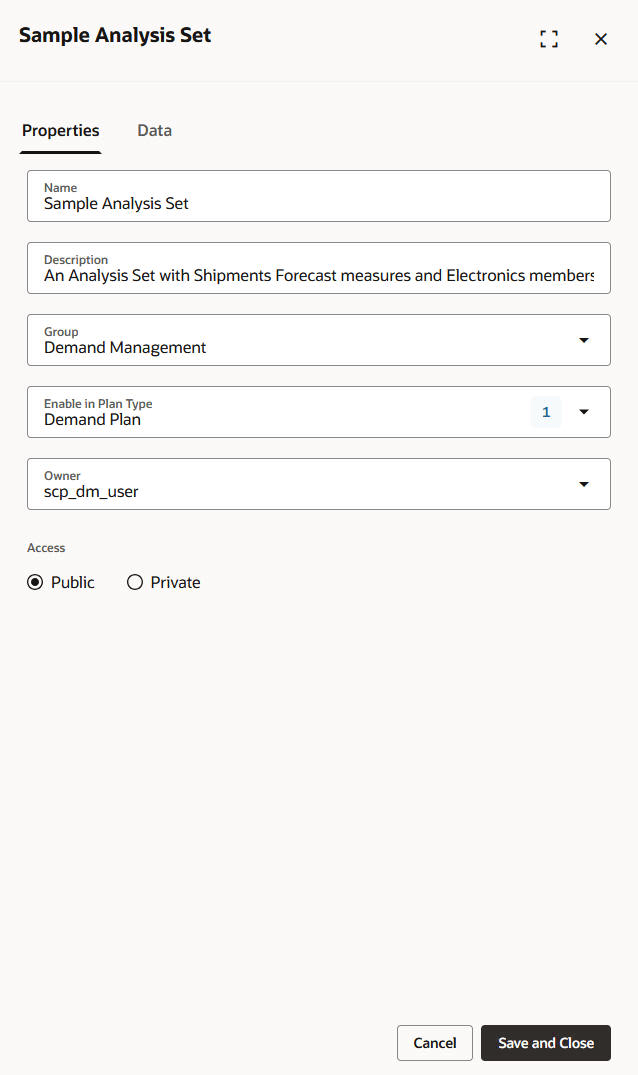
- On the Properties tab, enter a name and description, select a group, select the plan types for the analysis set, and select if the analysis set is public or private.
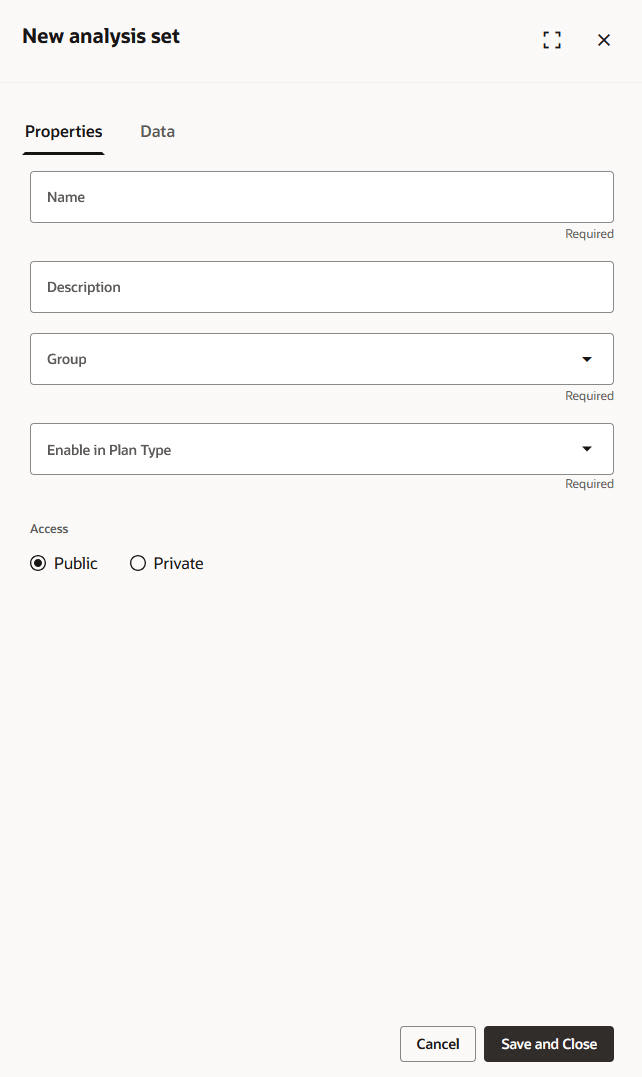
Properties Tab of New Analysis Set Drawer
- On the Data tab, on the Measures subtab, select the measures to include in the analysis set. You must select at least one measure.
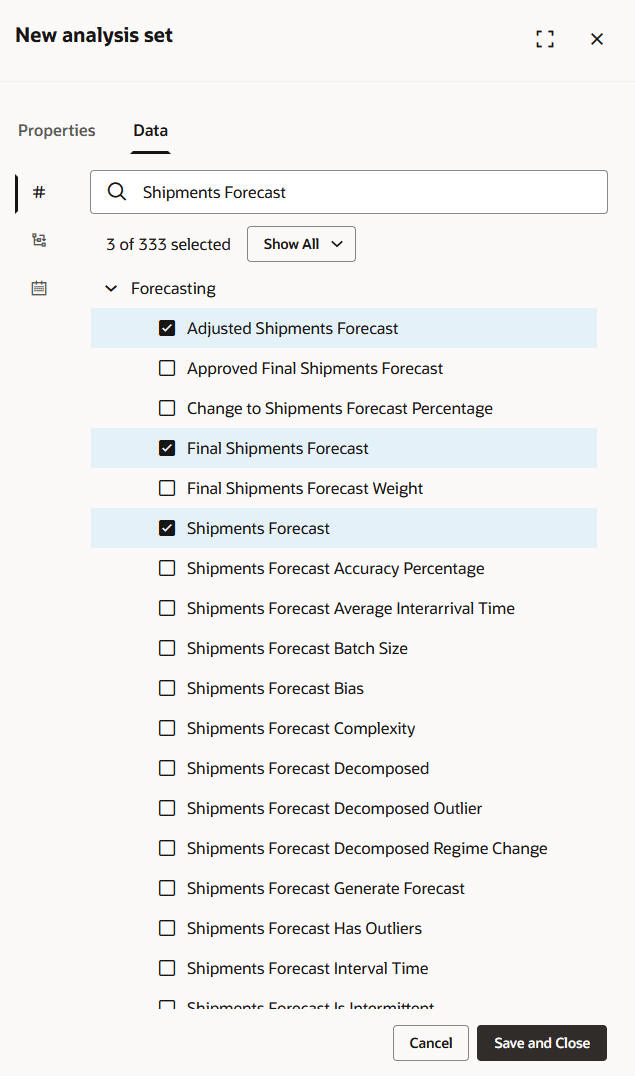
Measures Subtab on Data Tab in New Analysis Set Drawer
- On the Data tab, on the Members subtab, select the members to include in the analysis set. The dimensions available are based on the measures selected. Selecting members is optional.

Members Subtab on Data Tab in New Analysis Set Drawer
- On the Data tab, on the Time Members subtab, select the time-member filter to include in the analysis set. Selecting time members is optional.
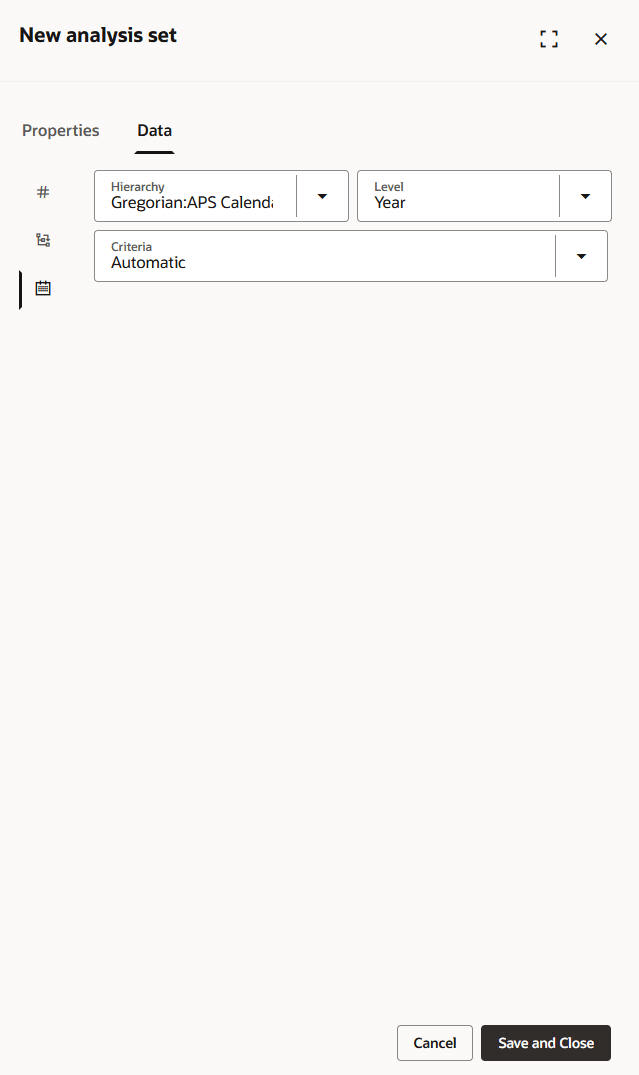
Time Members Subtab on Data Tab in New Analysis Set Drawer
- Select Save and Close.
Editing an Analysis Set
To edit an analysis set, select it on the page named Visualizations and Analysis Sets, and select the edit icon in the Actions column. The guided process drawer that you use to create an analysis set is opened. You can use this guided process drawer for your edits.
Drawer for Editing Analysis Set
Duplicating an Analysis Set
To duplicate an analysis set, select it on the page named Visualizations and Analysis Sets, and select the Duplicate button on the toolbar. A drawer will open where you can enter a name for the duplicated analysis set. A default name is generated with “(Copy)” added to the name of the original analysis set. You can modify the description, access selection, plan types, and group. When you select Save, the duplicated analysis set will be displayed on the page, and you can edit the analysis set.
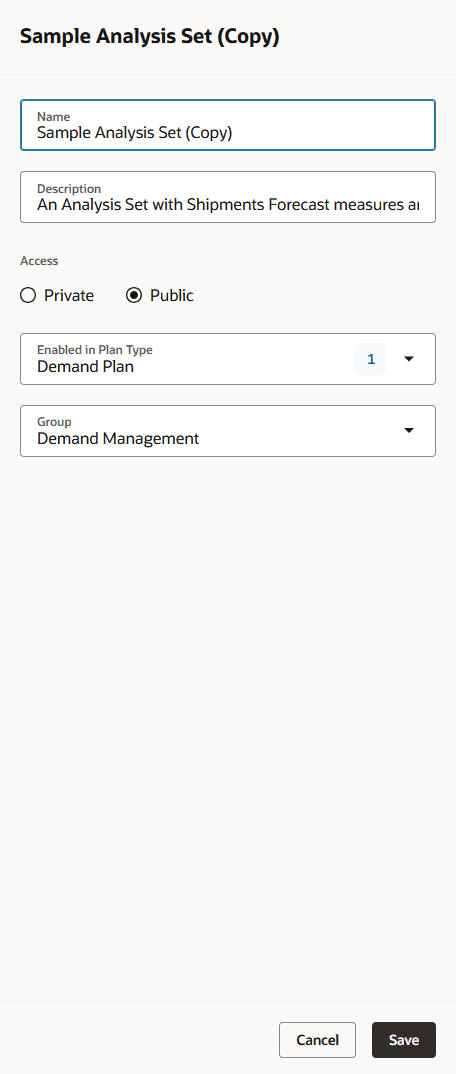
Drawer for Duplicating Analysis Set
Deleting an Analysis Set
To delete an analysis set, select it on the page named Visualizations and Analysis Sets, and select the Delete icon on the toolbar. A message will be displayed to confirm deletion of the analysis set.
Applying an Analysis Set to a Visualization
To apply an analysis set to a visualization, follow these steps:
- Open the visualization, and select Actions > Edit Properties.
A drawer will open for editing the visualization’s properties.
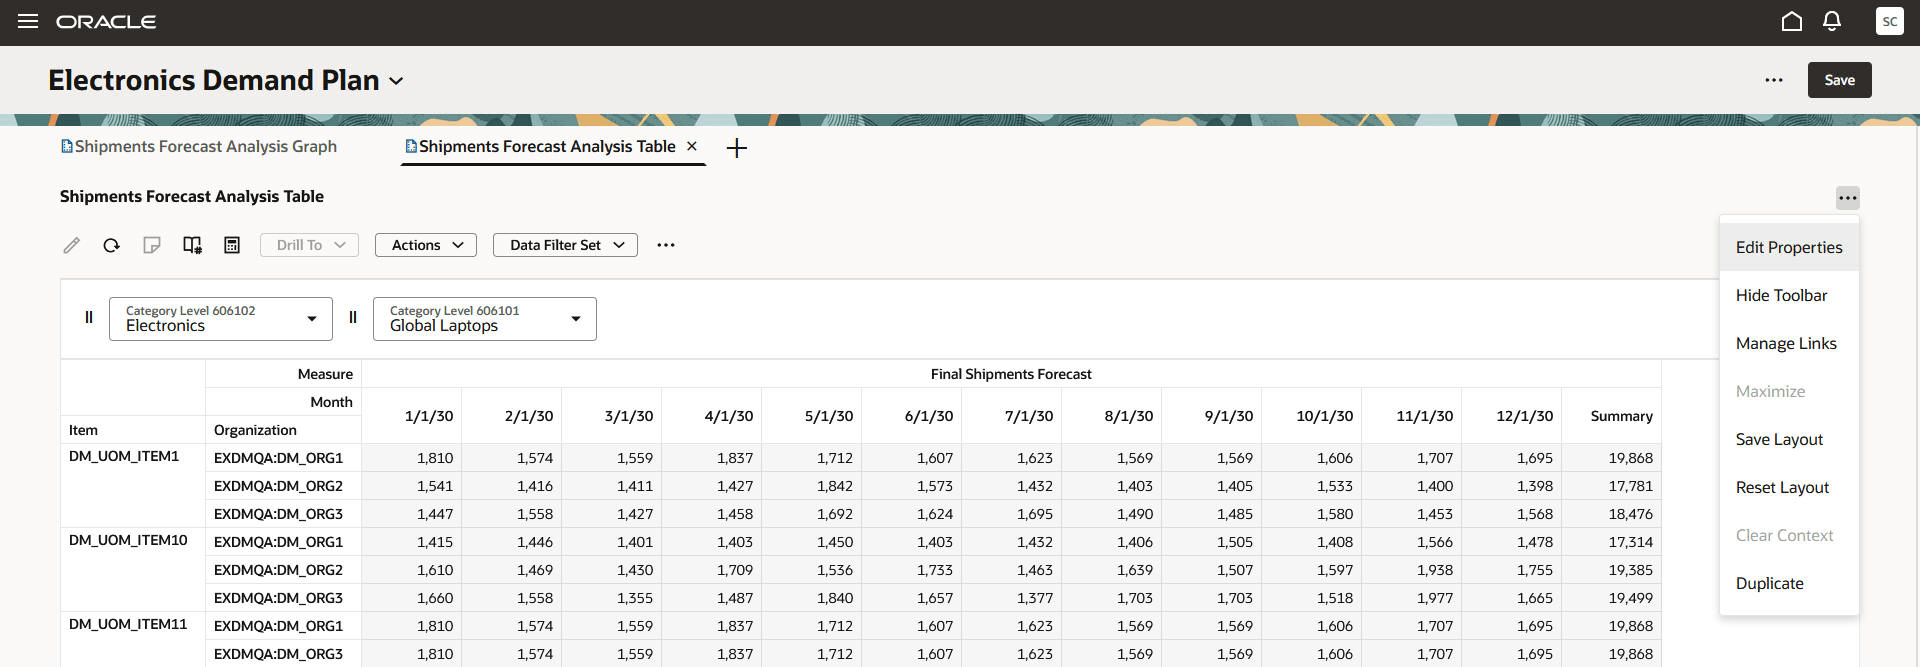
Edit Properties Menu Item
- On the Properties tab, select Apply Analysis Set.
A drawer will open where you can select the analysis set that you want to apply to the visualization.
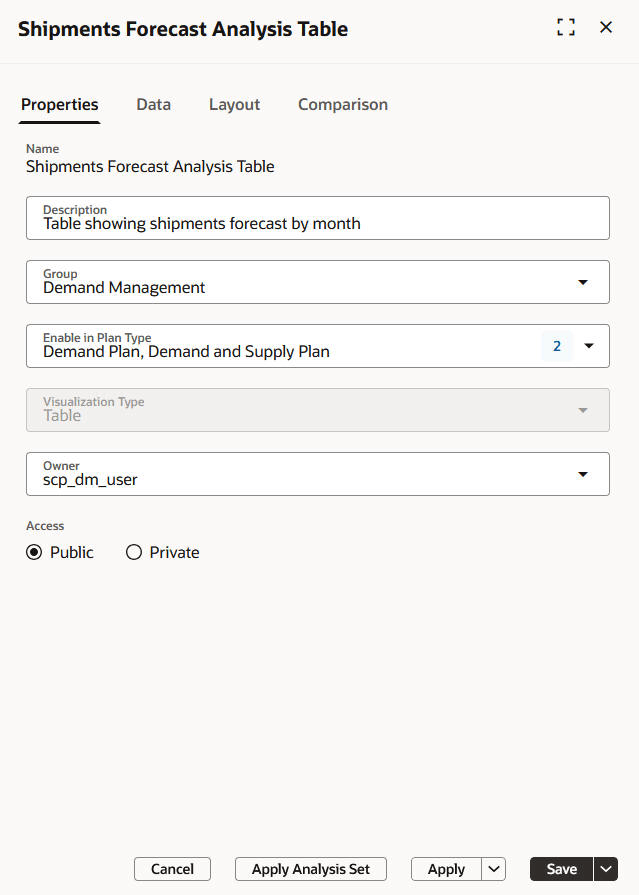
Properties Tab in Drawer for Editing Properties
- Do the following:
- Select Measures to copy the measures in the analysis set to the visualization.
- Select Members to copy the members in the Analysis Set to the visualization. Then, select the dimensions for which you want to copy members.
- Select Replace if you want to replace the measures and members in the visualization with those from the analysis set. This action will first remove the existing selections from the visualization and then insert the selections from the analysis set.
- Select Add if you want to retain the measures and members in the visualization and add those from the analysis set. This action will add the selections from the analysis set to the selections in the visualization.
- Select Cancel to return to the drawer for editing the visualization’s properties without applying the analysis set.
After you select Replace or Add, you will return to the drawer for editing the visualization’s properties.
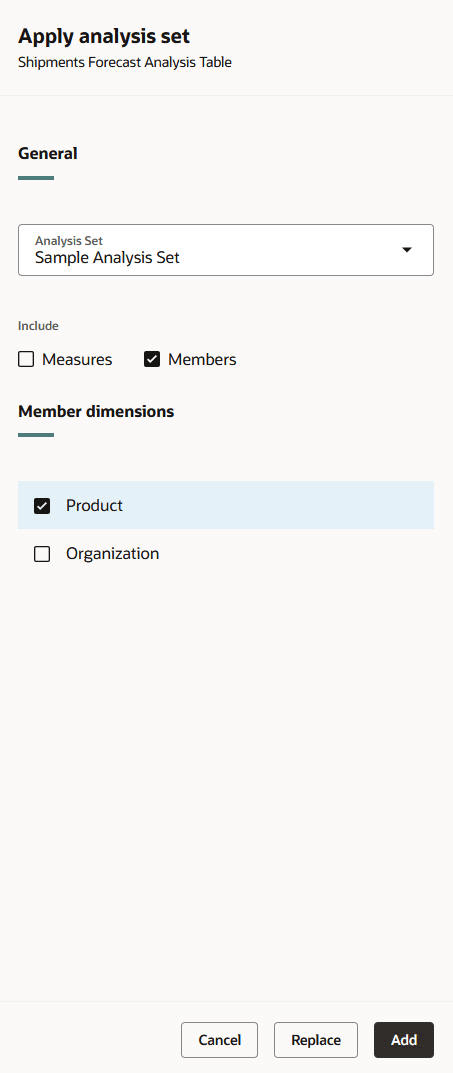
Analysis Set Drawer
- Select Apply and Close to close the drawer and display the visualization with these selections but without saving them. Select Save and Close to close the drawer, display the visualization with these selections, and save them.
Filtering Forecasting Profiles in Plans with Analysis Sets
You can use an analysis set as a filter for a forecasting profile in a demand, demand and supply, replenishment, or sales and operations plan when you want to forecast for a subset of the plan scope on the basis of the member filter in the analysis set.
To apply an analysis set to a forecasting profile for a plan, follow these steps:
- In the guided process for editing the plan’s options, on the Forecast Settings tab in the Demand step, select the Edit icon for the forecasting profile that you want to apply the analysis set to.
A drawer will open for the forecasting profile.
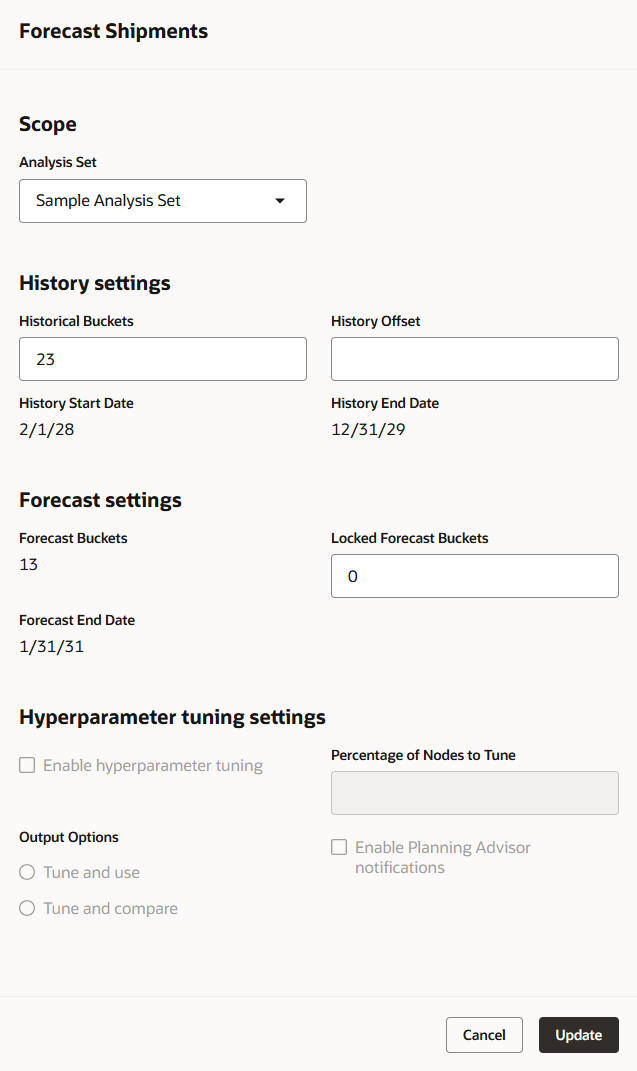
Drawer for Editing Forecasting Profile
- In the Scope section, select the analysis set.
- Select the Update button.
The drawer will close, and you will return to the Forecast Settings tab where the analysis set will be shown for the edited forecasting profile.
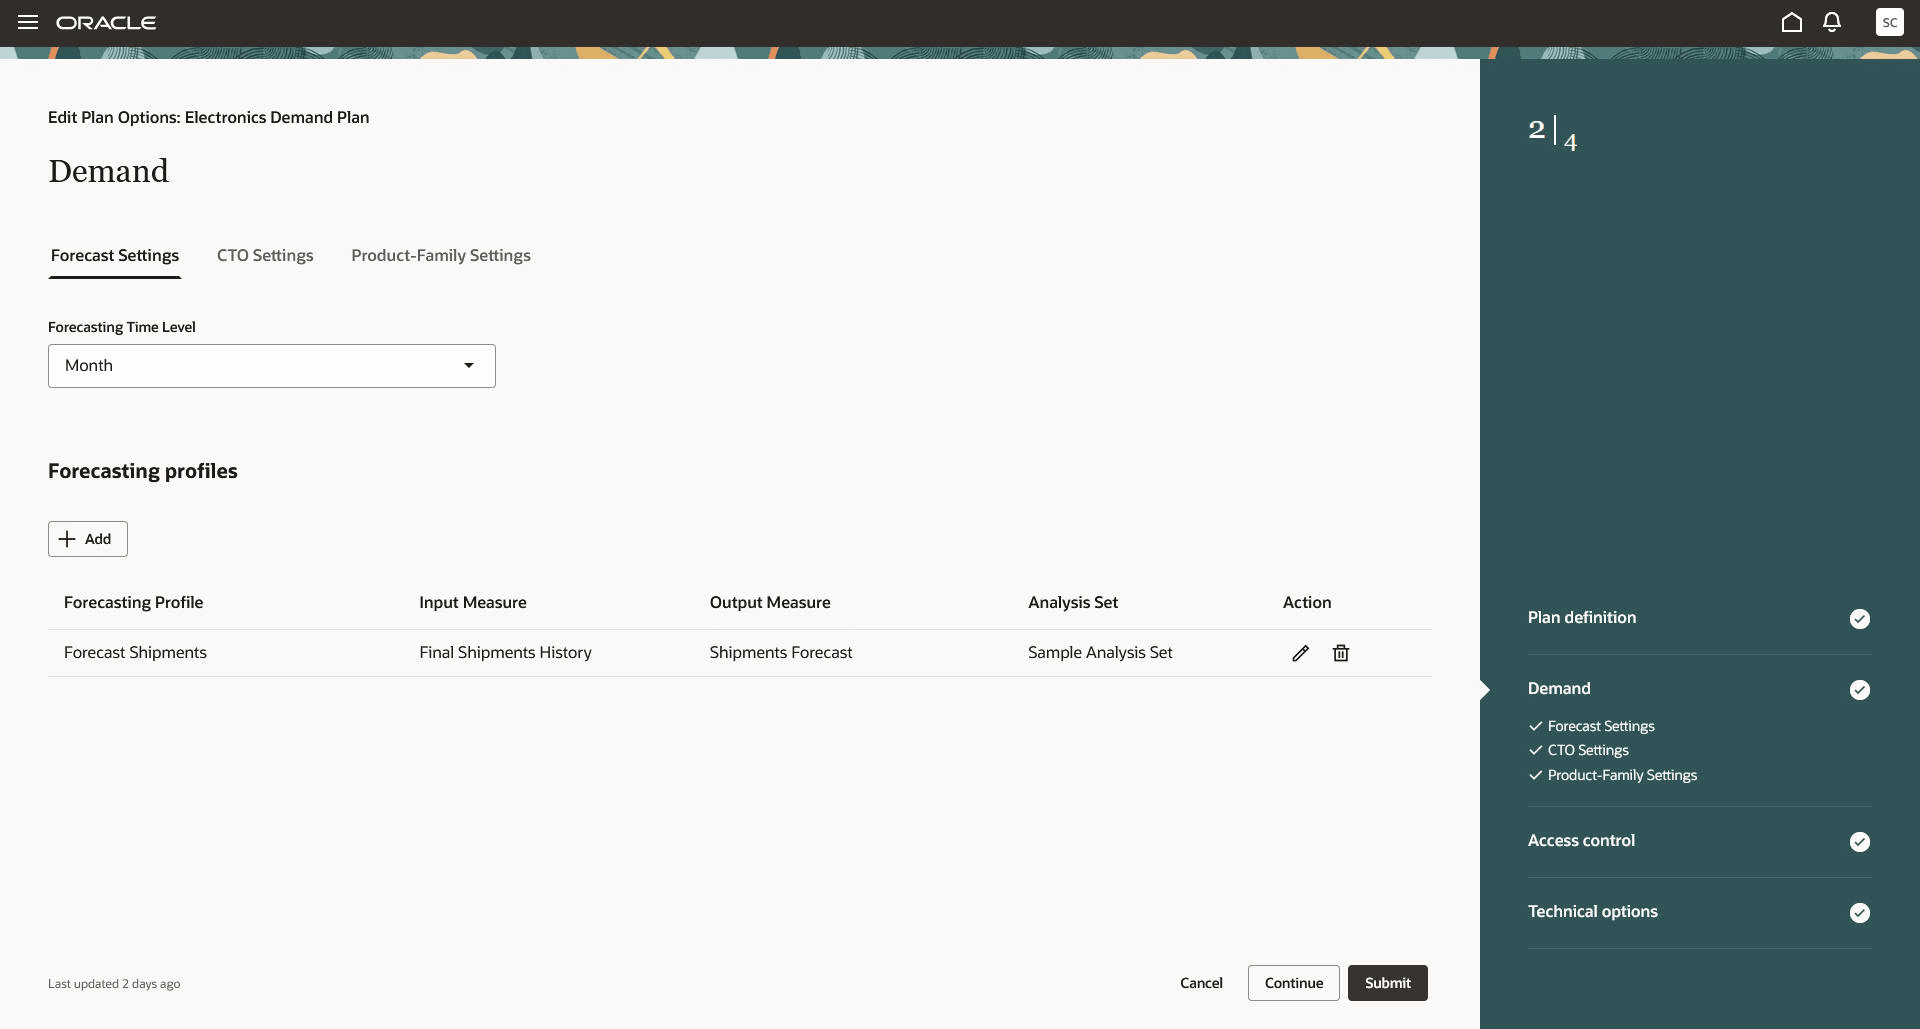
Forecast Settings Tab in Demand Step in Guided Process for Editing Plan Options
When this forecasting profile is used for the plan, the forecast will be generated for only the members currently selected in the analysis set instead of all the members in the plan scope. The measure selection in the analysis set isn’t used.
Steps to enable and configure
You don't need to do anything to enable this feature.
Tips and considerations
- When you apply an analysis set to a visualization, the selections from the analysis set are copied to the visualization at that point in time. There’s no link between the analysis set and the visualization. Any changes made to the analysis set after this point aren’t automatically applied to the visualization.
- When you apply an analysis set to a forecasting profile, the selected members in the analysis set are used when the plan is run with the forecasting profile selected. Any changes subsequently made to the members in the analysis set will be used the next time the plan is run with the forecasting profile selected.
- For simplifying the use of analysis sets, the following functionalities in the classic UI aren’t provided in the Redwood UI:
- In the classic UI, you can create an analysis set from a table or graph using the Save As Analysis Set button in the Selector Tool. In the Redwood UI, you can create analysis sets from only the Visualizations and Analysis Sets page.
- In the classic UI, when applying measures from an analysis set to a table or graph, you can select measures in the analysis set. In the Redwood UI, all the measures in the analysis set will be included.
- In the classic UI, you have the option to save the selected members in an analysis set as either a list (for saving the selected members) or a script (for saving the criteria for selecting the members). In the Redwood UI, analysis sets will include the selected members, which aligns with the List option in the classic UI. The selected members can’t be saved as a script in the Redwood UI.
Key resources
Visit https://redwood.oracle.com/ for more information about the Redwood experience.
Access requirements
Users who are assigned a configured job role that contains these privileges can access this feature:
- Edit Planning Analytics Configuration (MSC_EDIT_PLANNING_ANALYTICS_CONFIGURATION_PRIV)
- Maintain Planning Tables (MSC_MAINTAIN_PLANNING_TABLES_PRIV)
- View Planning Analytics Configuration (MSC_VIEW_PLANNING_ANALYTICS_CONFIGURATION_PRIV)
- View Planning Objects Using REST Service (MSC_VIEW_PLANNING_OBJECTS_REST_SERVICE_PRIV)
These privileges were available prior to this update.