Analytics: UX Enhancements of Infolet Dashboards in BUI
The look and feel of the already available infolet dashboards have been enhanced. The infolets dashboards provide the essential information in a visually pleasing and easily consumable format for the agents/supervisors. There are two canned infolet dashboards, Agent Overview and Service Overview dashboards, for monitoring their performance and contact center status. These infolets provide a brief overview of data about service performance, such as incident assignments and incident backlog, and can also be used by managers who need to get a quick view of information about the data.
Agent overview would summarise the data like their FCRR (First Contact Resolution Rate), RPA (Responses per Assignment), Current Backlog, etc, to keep track of their performance. Similarly, for supervisors, the service overview dashboard has the data to track the overall performance of their service center.
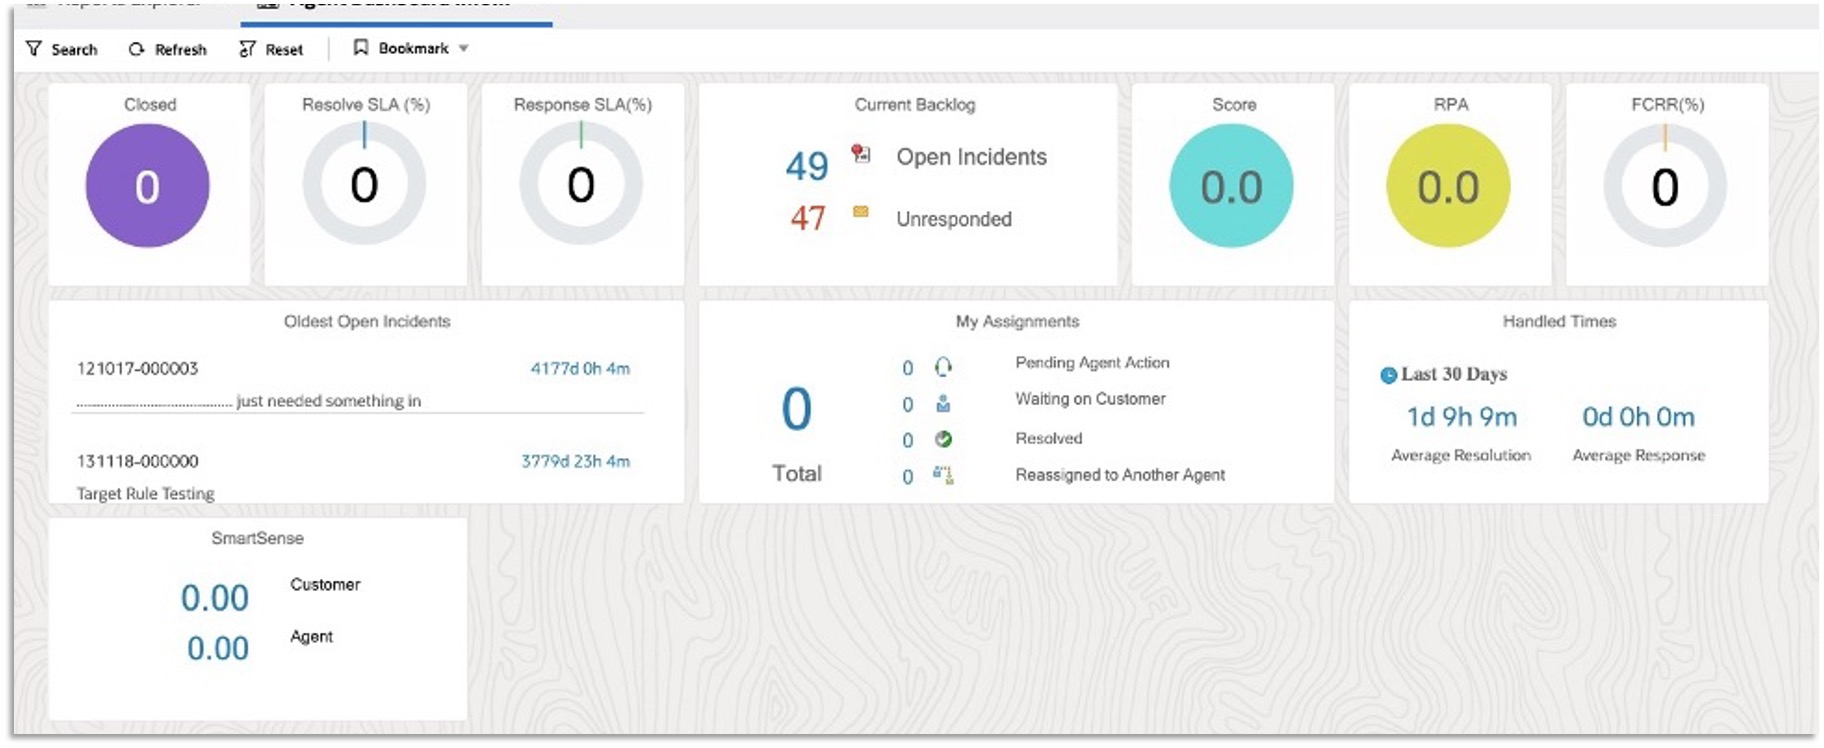
Agent Overview Dashboard
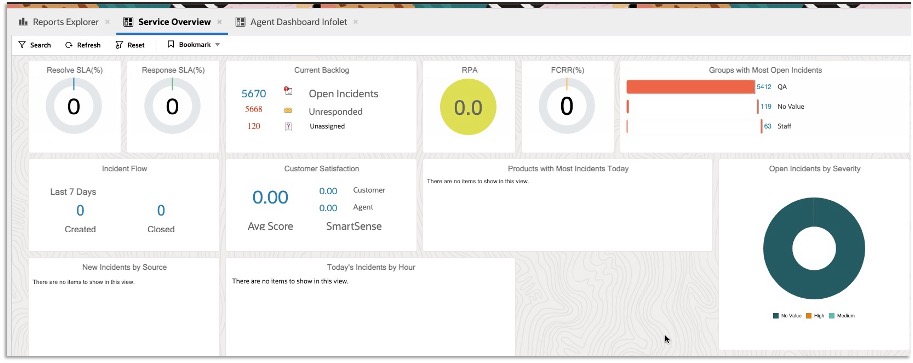
Service Overview Dashboard
The dashboards can be accessed by opening Infolets folder and located by searching the keyword "Infolets" in the report explorer of BUI.
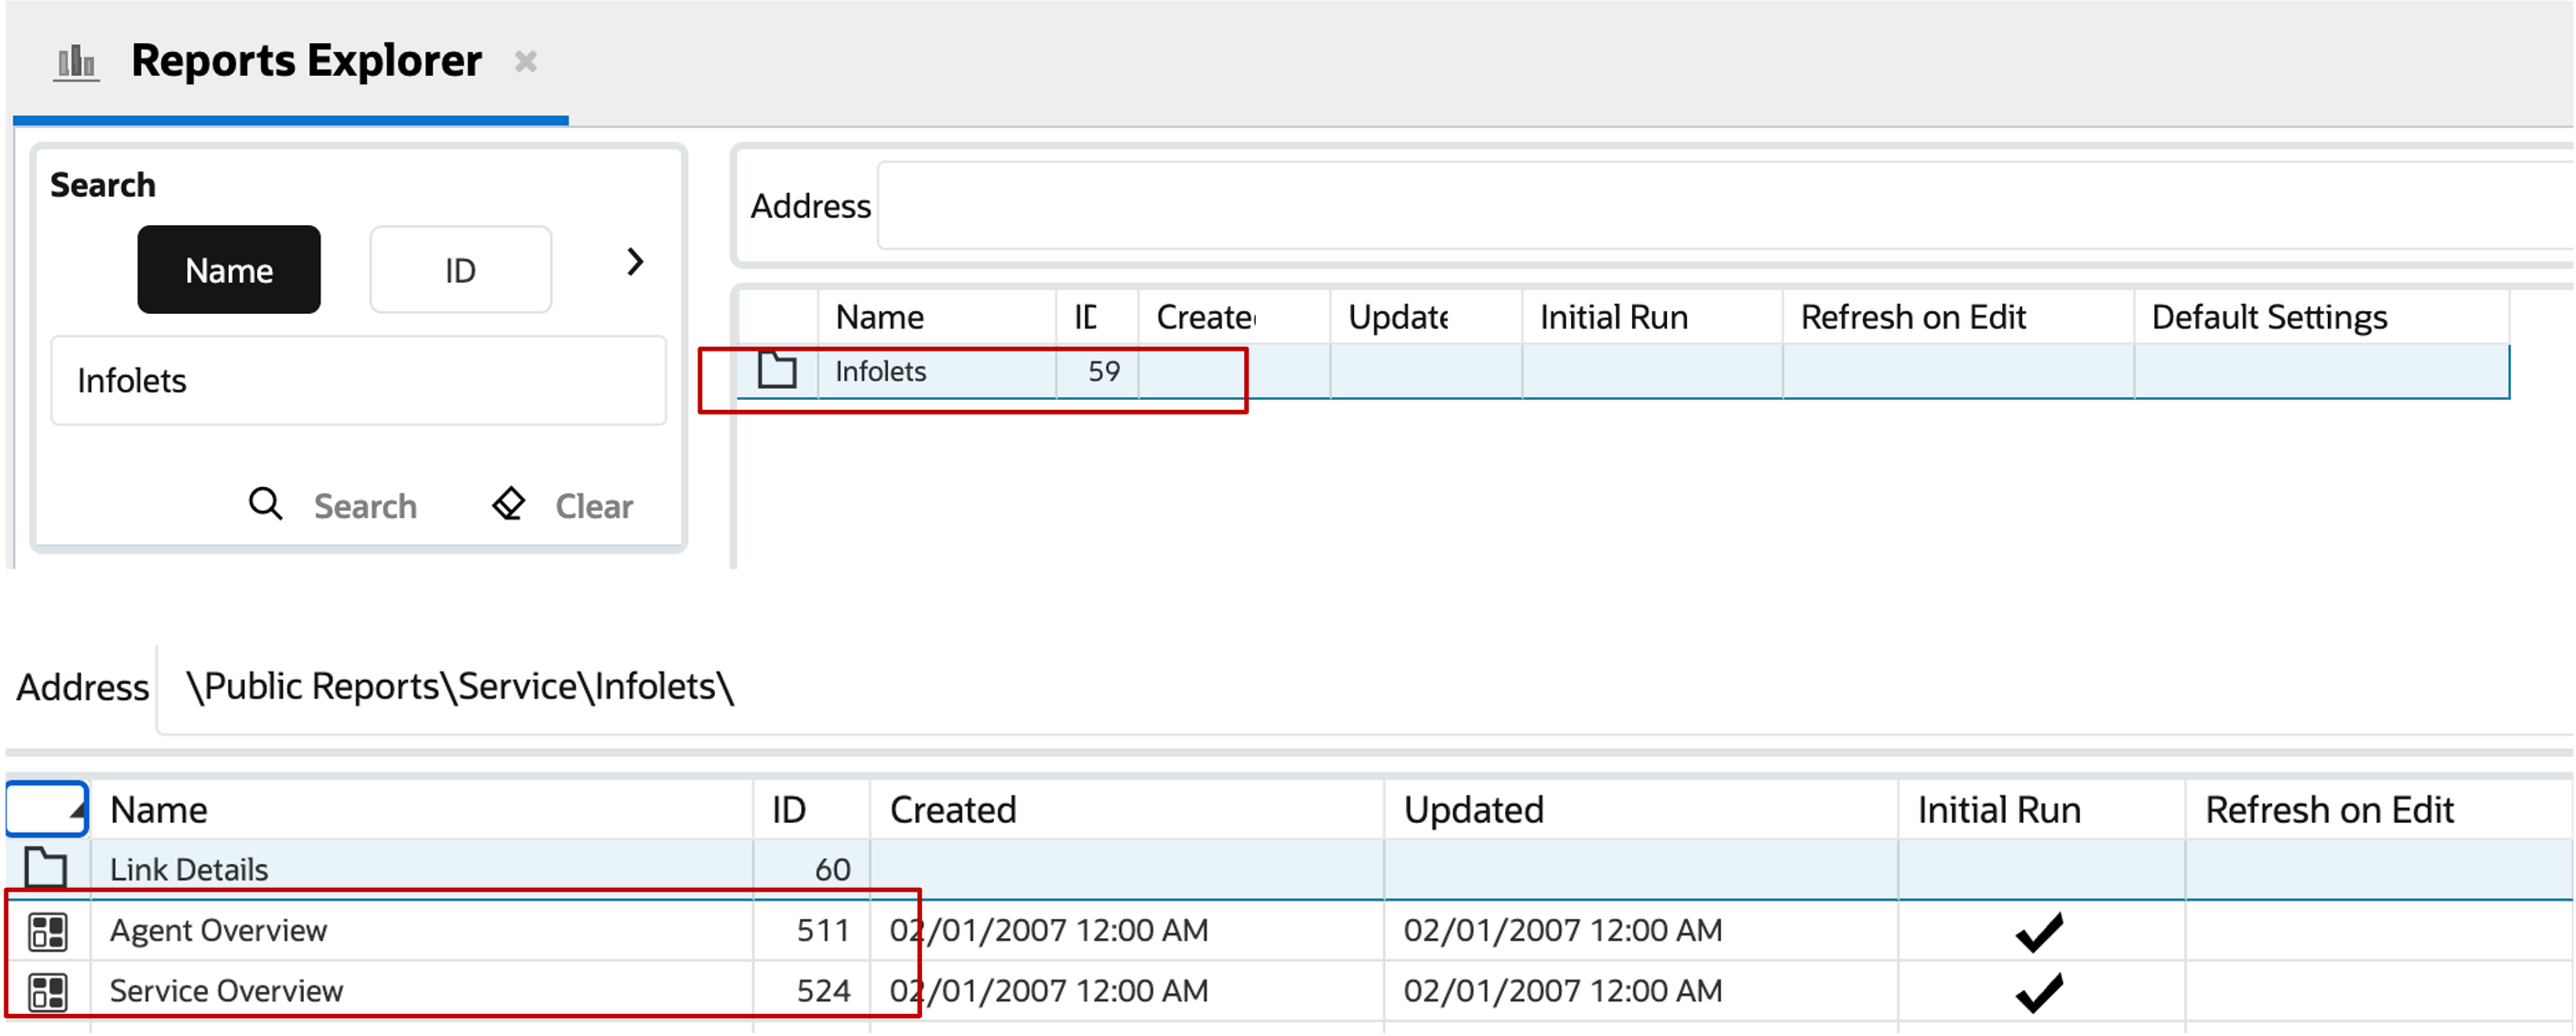
Report Explorer
Business Values:
- Easy to consume Data: Provide a visually rich means of displaying essential or summary information with a modern look and feel
- Modern looking UI
Steps to Enable
You don't need to do anything to enable this feature.
Tips And Considerations
This feature requires an upgrade to 24C.