Service Health Metrics: Dashboard in Browser UI
Service Health Metrics REST APIs are available so your organization can monitor the overall health of the Oracle B2C Service. In addition to the REST APIs, we offer an operational dashboard that presents data which is useful for monitoring the B2C Service solution. The operational dashboard is available for administrators to use and is located within the Browser UI.
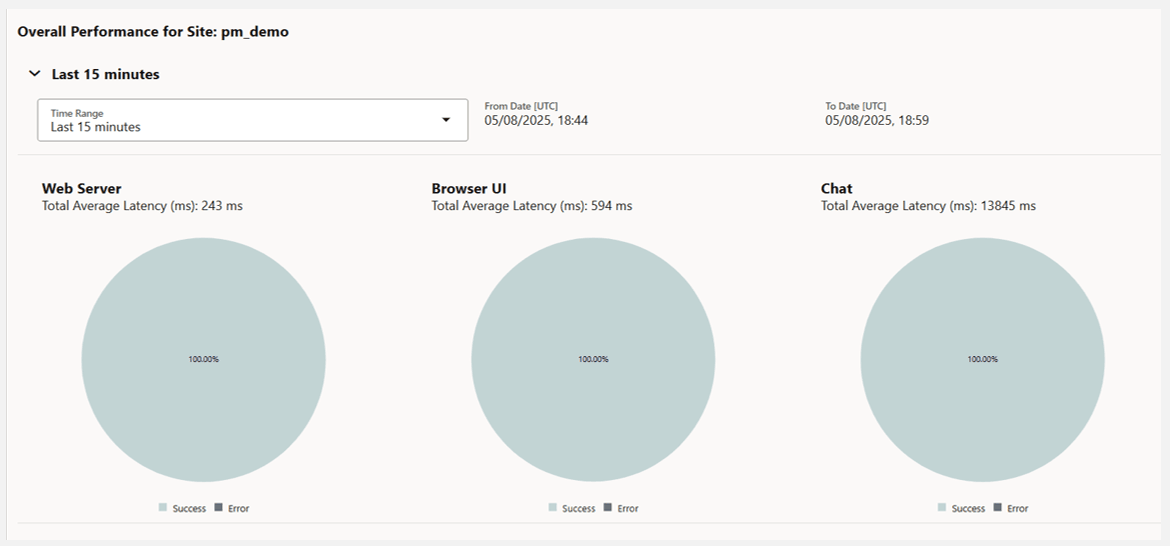
Within the dashboard, a series of charts and trend graphs provide the following key metrics for a specific site:
- Total Requests: The total number of all requests received
- Average Latency: The average time taken to process requests
- Success Percentage: Measures the percentage of successful HTTP requests (4XX and lower)
- Error Information: The count and percentage of unsuccessful HTTP requests (5XX only)
25B Service Health Metrics Dashboard in Browser UI
Business Value:
Observability: Provides data for the overall health of the CX service in an easily understandable format
Steps to Enable
You don't need to do anything to enable this feature.
Tips And Considerations
- Administrators can easily access the dashboard from within the Browser UI:
- Login to the Browser UI
- Go to the menu in the upper left corner
- Go to “Administration”
- Go to the tile for “Service Health Metrics Dashboard”
- More information can be found at cx.rightnow.com by searching for "Service Health Metrics: Operational Dashboard in Browser UI"
- This feature does not require a CX upgrade
- This feature does not require a feature flag
- The dashboard is included in the May III release of Browser UI, and available on test sites beginning May 15th 2025, and available on production sites beginning May 29th 2025
Access Requirements
- B2C Service Administrator