Analytics: BUI Report UI Enhancements
The 25B release brings several improvements to BUI report rendering, focused on enhancing user experience and ensuring reports align with the .NET report designer:
- Smooth Chart Loading and Refreshing Animations: Dynamic animations make chart loading and refreshing lively and engaging.
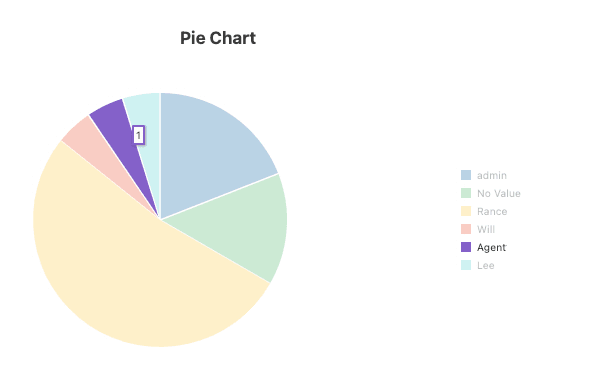
- Select/Unselect Data Series: Toggle the visibility of data series directly from the chart legend.
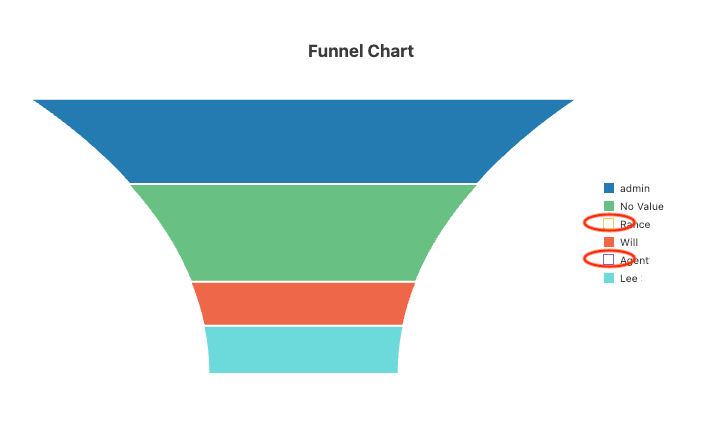
- Hover to Highlight: Hover over chart data elements or legends to highlight relevant data points.
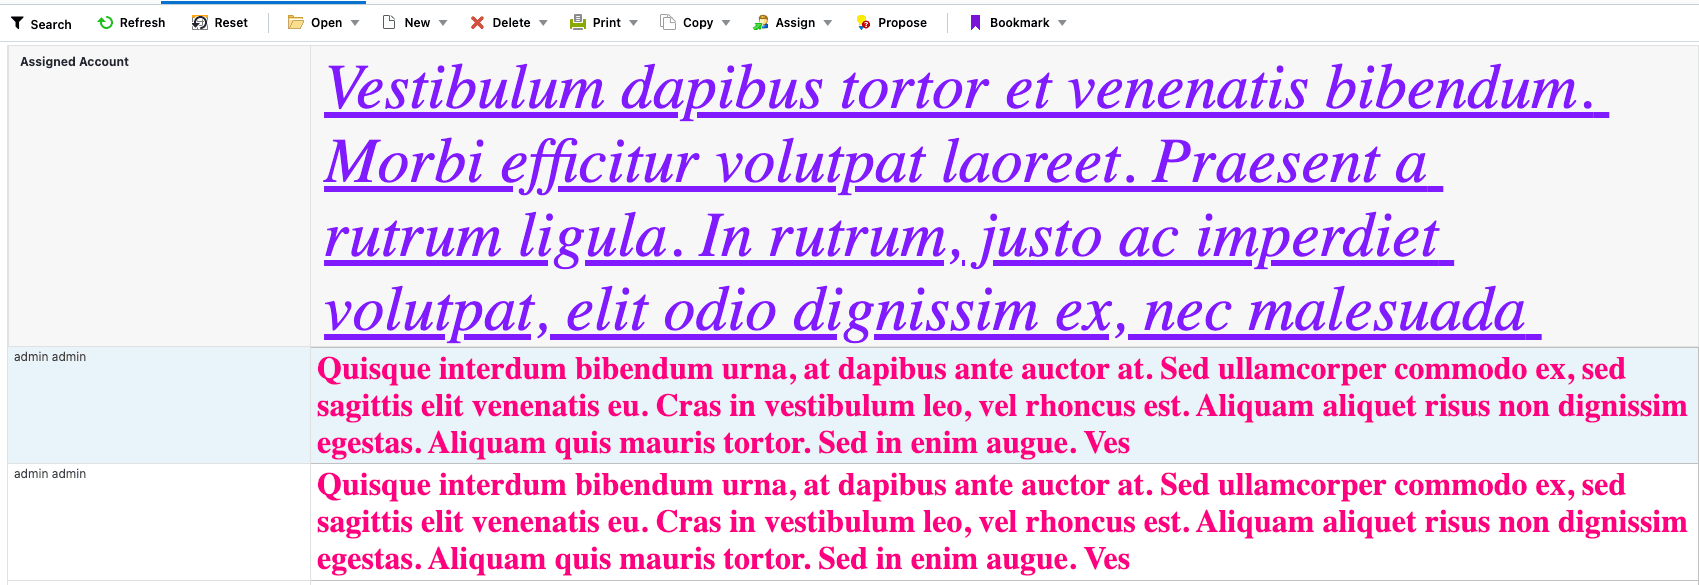
- Honor Grid Report Header Line Limits: Grid reports will respect header line limits from the .NET Report Designer for optimized real estate management.
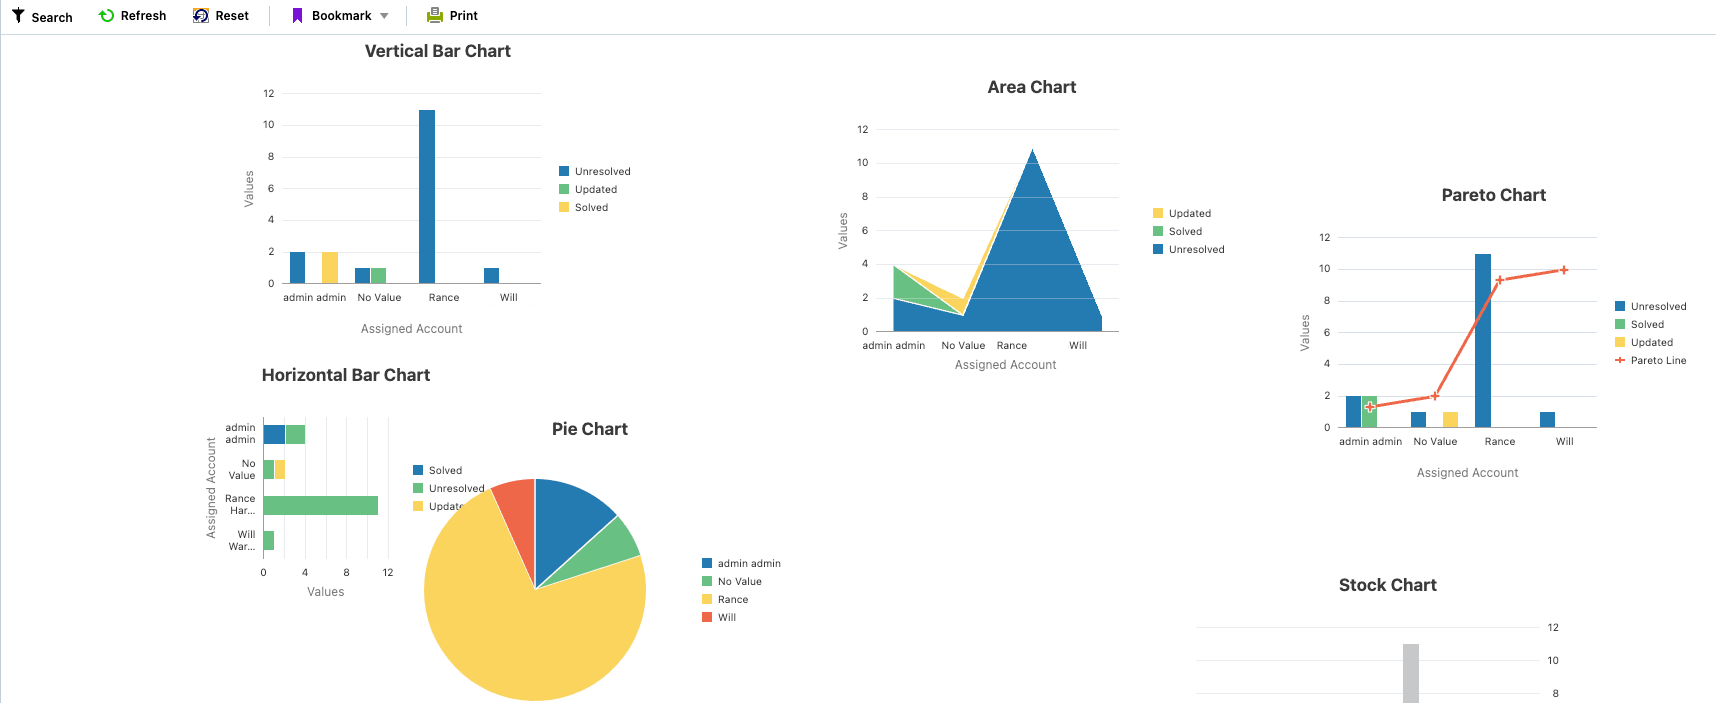
- Honor Chart Layout Configuration: Charts in BUI will reflect the layout configuration from the .NET Report Designer for consistent design.
These enhancements create a more engaging, visually optimized report experience and more aligned with design configurations from the .NET Report Designer.
Business Value:
- Enhanced Visual Appeal of BUI charts with smooth chart loading and refreshing animations for a more dynamic experience.
- Improved Data Clarity through hover-based data point highlighting and select/unselect data points in BUI charts.
- Consistent Design that reflects the intended layout and grid header limits in BUI from the .NET Report Designer for better real estate management.
Steps to Enable
You don't need to do anything to enable this feature.
Tips And Considerations
This feature does not request an upgrade to 25B and is pushed to your sites automatically.