Support Scorecards on KPI and Custom Dashboards
Administrators can now optionally group infolets under scorecards on both KPI and custom dashboards. This added layer of organization improves clarity by allowing related KPIs and metrics to be visually grouped together. Each scorecard can contain up to five infolets, offering a flexible yet structured layout to better align with the reporting needs of different roles.
This enhancement improves usability and information clarity on KPI and dashboards by enabling administrators to logically organize related infolets under meaningful scorecard groupings. It supports faster data interpretation, reduces cognitive load for users, and allows dashboards to scale gracefully as more metrics are added over time. This capability is especially valuable for role-based reporting, where different user groups benefit from tailored visual groupings of key performance indicators.
Steps to enable and configure
Custom scorecards can be added to KPI Dashboards and Custom Dashboards in Fusion Service Analytics. By default, this capability is disabled. Administrators must explicitly enable it and complete the required setup steps before custom scorecards can be used.
Adding Scorecards to Custom Dashboards
Follow these steps to add scorecards to custom dashboards:
- Sign in with administrative privileges
- Navigate to Service --> Service Dashboard
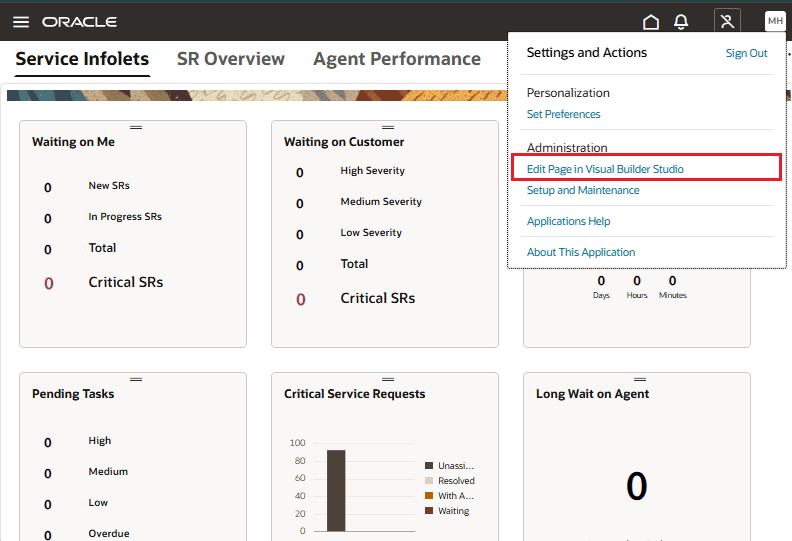
- Click your user initials in the top-right corner and select Edit Page in Visual Builder Studio
- Open the appropriate project to proceed with customization
Open Visual Builder Studio
In Visual Builder Studio, edit the page configuration as follows:
- Locate the enableCustomDashboard constant under the otbi section and set its value to true. This setting controls whether custom dashboards are displayed.
- Next, locate the enableCustomDashboardScorecards constant under the same otbi section and set its value to true. This setting controls whether scorecards can be added to custom dashboards
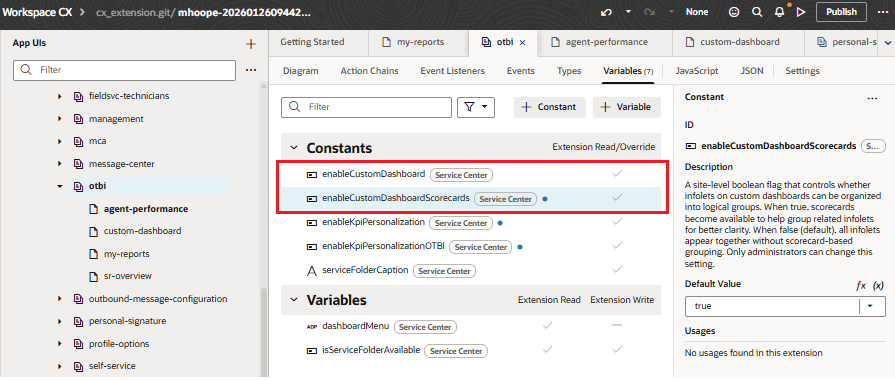
Set the two configuration constants to true
Publish the changes.
Next, sign in to the Oracle BI application with authoring privileges. Browse the catalog and locate the folders used to display custom dashboards at runtime.
- If the Service folder exists, each subfolder under Shared Folders > Custom > Dashboards > Service is treated as a custom dashboard and displayed at runtime
- If the Service folder does not exist, each subfolder under Shared Folders > Custom > Dashboards is treated as a custom dashboard and displayed at runtime
In both cases, only custom dashboards that the signed-in user is entitled to access are displayed at runtime.
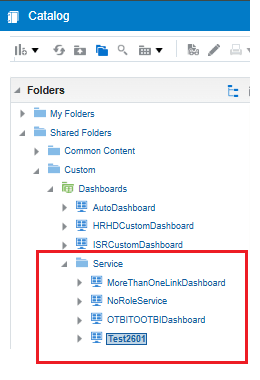
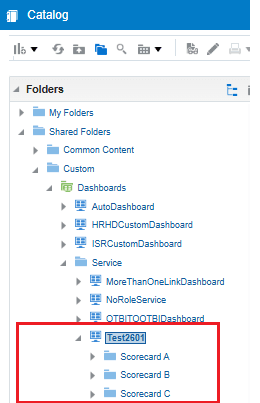
Custom Dashboards folder structure in Oracle BI
Locate the custom dashboard subfolder where scorecards are required. In this example, the Test2601 folder represents the custom dashboard.
To add scorecards to this dashboard, define each scorecard as a separate subfolder under the Test2601 folder. For example, if three scorecards are required for the Test2601 custom dashboard, create three subfolders under Test2601 as shown below.
One subfolder for each scorecard
After creating the scorecards, represented by the subfolders, move all pre-existing reports into the appropriate scorecard subfolder.
If a custom dashboard, such as Test2601 in this example, has scorecards defined, any report that is not placed within a scorecard subfolder is ignored and not displayed at runtime. For example, the Avg Resolution Time report shown below is ignored because it is not part of any scorecard
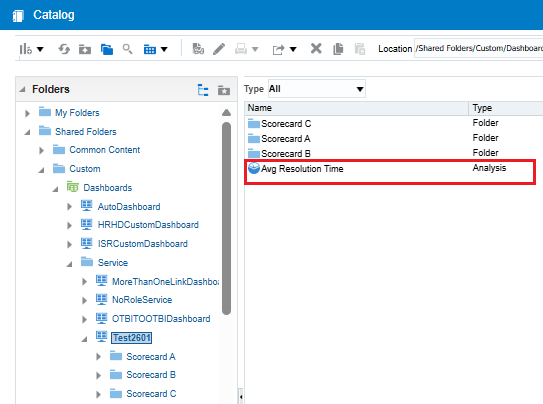
Reports not part of scorecard folders are ignored at runtime
When a scorecard is displayed on a custom dashboard, a trend can optionally be shown within the scorecard. The trend data is sourced from a report located in the same scorecard folder.The report used for the trend is identified through the Description attribute of the scorecard folder. The description must include the following pattern:
##SCORECARD@@<filename>##
In this example, Scorecard C displays a trend, and the trend data is provided by an analysis named All SRs – Query. As a result, the Description attribute of the Scorecard C subfolder contains the string:
##SCORECARD@@All SRs – Query##
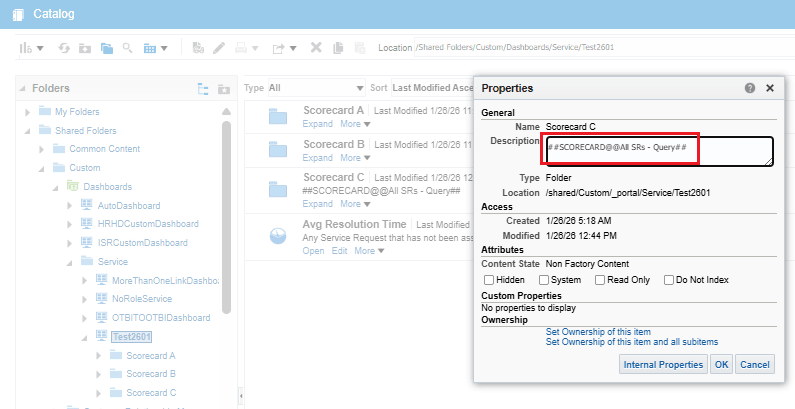
Description attribute of the scorecard subfolder
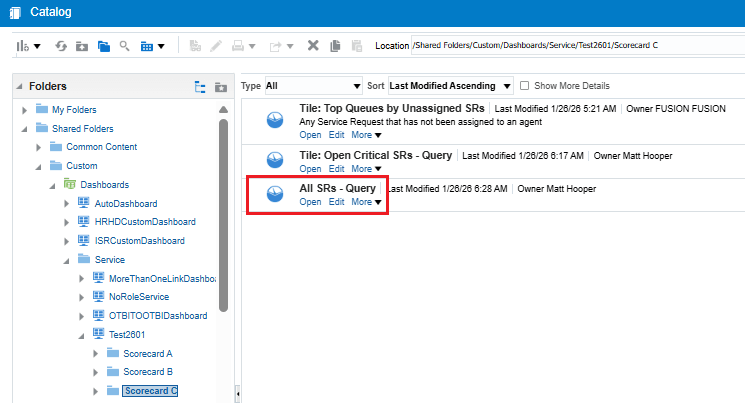
Datasource must be a file present in the same scorecard subfolder
Based on this setup, the custom dashboard and its associated scorecards are rendered at runtime as shown below. Because a trend data source is defined only for Scorecard C, only that scorecard displays trend information. Scorecard A and Scorecard B do not display any trend.
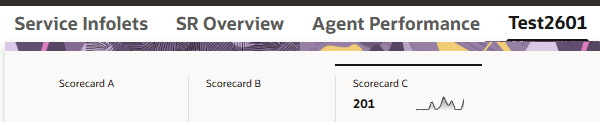
Scorecard within a custom dashboard
Adding Custom Scorecards to KPI Dashboards
Follow these steps to add scorecards to KPI dashboards:
- Sign in with administrative privileges
- Navigate to Service --> Service Dashboard
- Click your user initials in the top-right corner and select Edit Page in Visual Builder Studio
- Open the appropriate project to proceed with customization

Open Visual Builder Studio
In Visual Builder Studio, edit the page configuration as follows:
- Locate the enableKpiPersonalization constant under the otbi section and set its value to true. This setting controls whether you can browse for and add reports from RODS to the KPI dashboard
- Next, locate the enableKpiPersonalizationOTBI constant under the same otbi section and set its value to true. This setting controls whether you can browse for and add reports from OTBI catalog to the KPI dashboard
Note: It is sufficient if either of the two constants above is set to true.
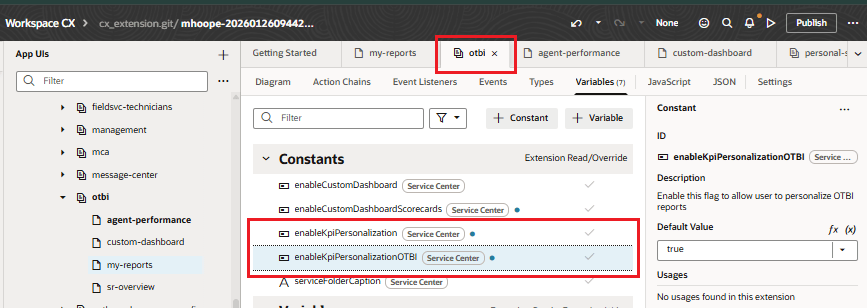
At least one of the two constants should be set to true
Next click on the agent-performance tab and click on the scorecardLibrary constant.
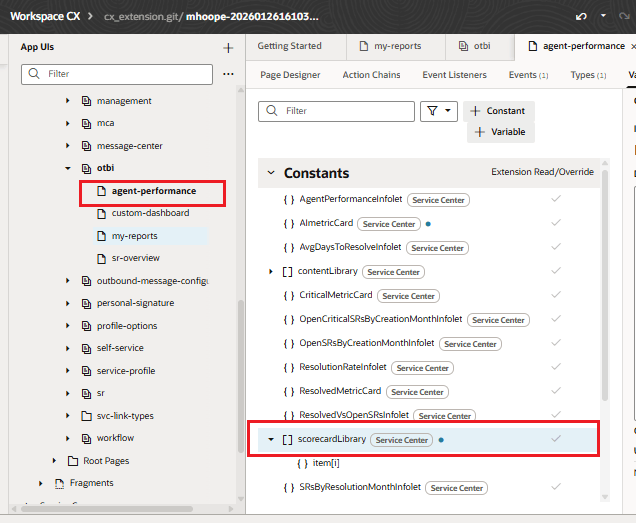
Click on the scorecardLibrary constant
In the text box labelled Default Value, paste a JSON snippet like the following:
[
{
"id": "Custom Scorecard 01",
"title": "Custom Scorecard 01",
"type": "kpi",
"viewType": "",
"icon": "oj-ux-ico-object-card",
"data": {
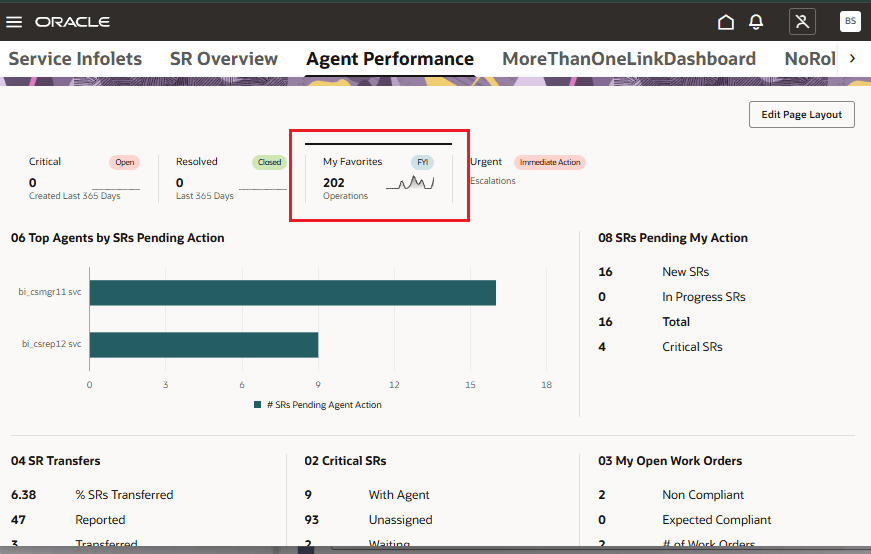
"scorecardID": "My Favorites ID",
"scorecardTitle": "My Favorites”, "scorecardText": "Operations", "scorecardMetricBadgeStatus":"info", "scorecardMetricBadgeText":"FYI",
"scorecardReportPath":"/shared/Custom/_portal/Service/Test2601/Scorecard C/All SRs - Query", "scorecardMetricReportColumn":"Column1"
}
},
{
"id": "Custom Scorecard 02",
"title": "Custom Scorecard 02",
"type": "kpi",
"viewType": "",
"icon": "oj-ux-ico-object-card",
"data": {
"scorecardID": "Urgent Metrics",
"scorecardTitle": "Urgent",
"scorecardText": "Escalations",
"scorecardMetricBadgeStatus": "danger",
"scorecardMetricBadgeText": "Immediate Action"
}
}
]
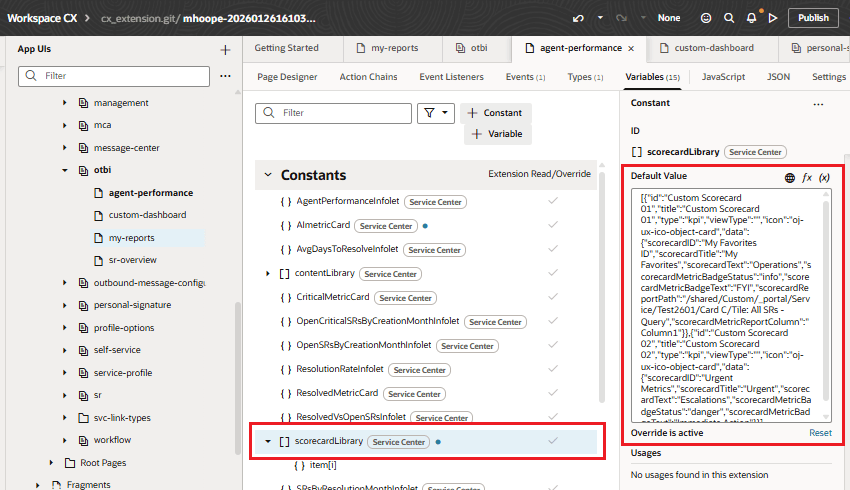
Define the value for the scorecardLibrary constant
Here is a brief explanation of the various elements in the above snippet
Properties
| id | Unique identifier of the placeholder metric card. Any string is acceptable if it is unique |
| title | Display name of the placeholder metric card. This is what is displayed as a KPI item to drag-and-drop |
| type | "kpi" |
| viewType | <blank> |
| icon | oj-ux-ico-object-card |
| scorecardID | Identifier of the scorecard on the scoreboard |
| scorecardTitle | The name or title that appears on the scorecard after it was drag-and-dropped onto the scoreboard |
| scorecardText | The text that appears at the bottom of the scorecard after it was drag-and-dropped onto the scoreboard |
| scorecardMetricBadgeStatus | Type of badge to display on the scorecard |
| scorecardMetricBadgeText | Badge text on the scorecard |
| scorecardReportPath | The full path of the report that can act as the data source if you want to show trends on the scorecard |
Publish the changes. Setup is complete. Log out.
The above scorecards will appear when the user is personalizing the layout of the dashboard and browsing a list of reports.
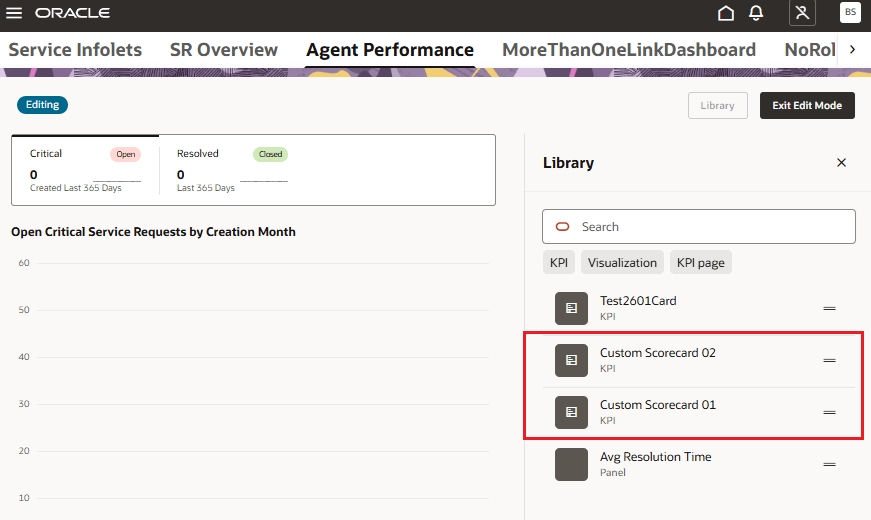
Custom Scorecards listed for selection
User can drag and drop any of the scorecards to the scoreboard. In the example below, the scorecard labelled “Custom Scorecard 01” was dropped to the scoreboard.