Responsive Sizing on Interface Pages
Analytics and analytic interface components all must have the sizing set for responsive sizing to work.
Set the Analytics Tabs on Interface Pages
Once your analytic is set with the proper sizing, the next step is to add the analytic to your interface and set the layout specifications.
-
Add the analytic to the object tab.
-
Open a sandbox.
-
Under Setting and Actions choose Edit Pages.
-
In the Edit Pages dialog, select internal.
-
Click OK.
-
Navigate to the page to set up.
-
Click Change Layout.
-
Navigate to the analytic and click Add.
-
Click Edit.
This shows the edit option for a dashboard container. 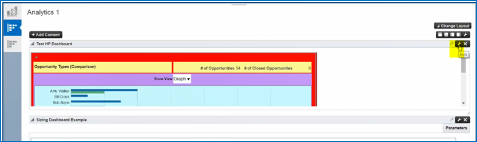
-
Under the Parameters tab, change the sizing to "content" and remove any height and width values so that the field is empty.
This shows the Height and Width options as well as the Sizing option. 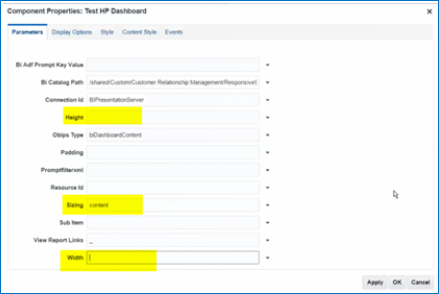
-
Click the Display Options tab.
-
Click the Advanced tab.
-
Under Stretch Content, set the value to "false".
Best Practices For Sizing
Traditional BI Content typically doesn't have all these sizes specified. The following are some recommendations for getting the best sizing results.
-
Use original content as a guide and size from the inside out., Start adding sizes for views first. Follow this by adding sizes to view containers. Save the report then make adjustments to Dashboard Sections, and then Dashboard Columns. When tweaking dashboard containers, set their size to the specific size then tweak to minimize scroll bars.
An inspector tool like Firebug can make this process much easier by allowing temporary edits in place. You can then go back and add the values in the dialog. Add 20 pixels to dashboard container heights as this gets deducted by the dashboard code (presumably to reserve space for the collapsible icon).
When you're done tweaking, set the dashboard, columns, and sections to the minimum size setting. This setting removes the overflow behavior and prevents scroll bars from appearing on BI content.
-
Measure pixels in original content to obtain starting size values. Use a pixel measuring tool (like Measure or others) to measure pixels on the screen to find starting sizes for views. Similarly, measure pixels on the screen to help figure how many pixels to add or deduct for components that can't be resized within views. For example, the View Selector widget needs approximately 40 pixel height.
-
Build in padding sizes. BI styles typically have some padding built in to their CSS. The BI resizing code works best when taking this into account. Moving from sections to columns, try adding 3 pixels per border. For example, if you have two sections in a single dashboard column, they contribute four borders. So make the column value 12 pixels larger than the sum of the sections. When working up from views to view containers, try adding the same 3 pixels per border. Note that the 3 pixel padding recommendation is suitable for the Alta style. Custom styles may need more or less padding to be built into the math. You can validate the dashboard behavior using the specific size setting. In general, more padding is safer but could contribute marginally to less predictable behavior.
-
Make sure the math works out. BI builds up the sizing map based on nested layout objects. Resizing falls apart if any parent container size is sized smaller than the content that it contains. For example, if a graph size is 300 x 200 and its view container is 350 x 250, then section and column containers must be larger than 350 x 250. If the section were set to 300 x 200, for instance, resizing wouldn't work.
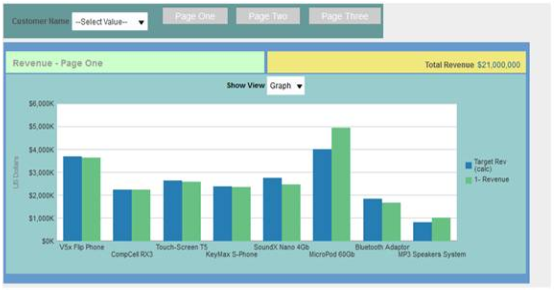
This shows a dashboard with an analysis that has a compound layout with titles and two views to choose from. Colors added to highlight the layout components.