Why Use Responsive Sizing?
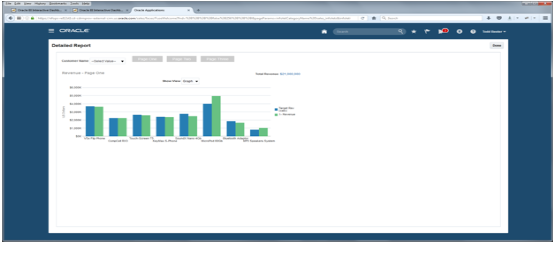
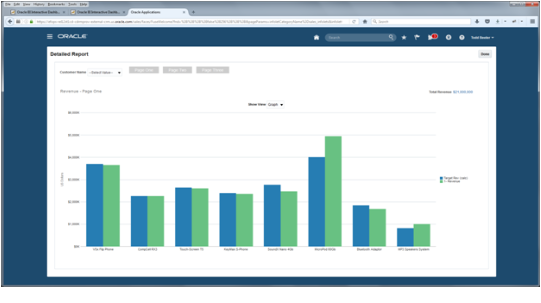
Responsive sizing ensures that analytics are displayed on your laptop, mobile, or tablet browser in the best possible way. By default you can configure analytics to fit any format, but that doesn't make them responsive to your browser resolution.
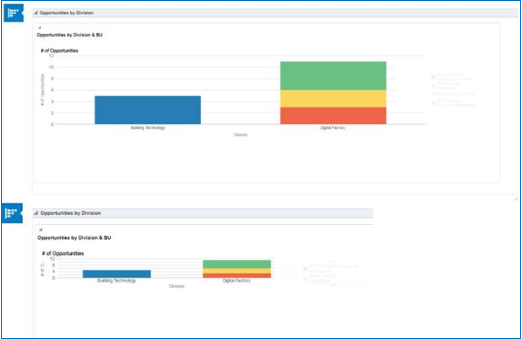
When you enable responsive sizing, you ensure the analytic size adjusts to the screen size on your device. This ensures that you view an analytic in as much screen space as possible without distorting the image. Not only does the window adjust to maximize the screen display on the device, but it enables a scroll in the cases where the analytic rows extend beyond the screen size.
Things to Keep in Mind
You can't opt into responsive sizing globally. And Prebuilt analytics can't be set for responsive sizing unless you make a copy. There are a few steps to opt in for each analytic you want enabled.
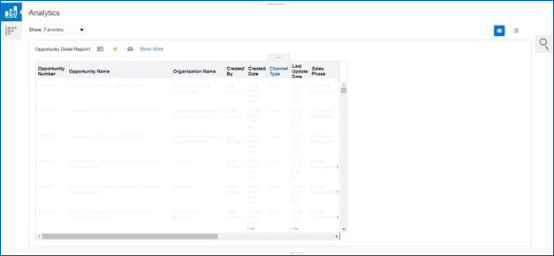
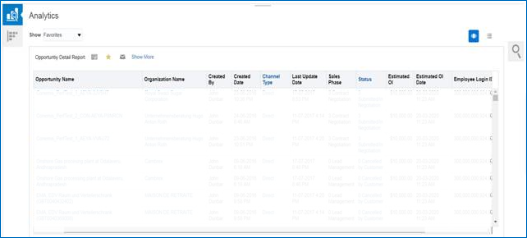
If you have multiple BI objects on a page, responsive sizing doesn't work. But you can embed a dashboard, or layout quadrant, which can then express multiple analytic objects with responsive sizing. For table views, if it has a large number of columns it will scroll.
You need to set every analytic that you want to be responsive. In some cases you configure the page the analytic is on. This summarizes the pages and steps for setting responsive sizing.
|
Page Name |
Setup Requirements |
|---|---|
|
Object Landing or Object Edit Page tabs |
|
|
BI Dashboards |
|
|
Sales and Service Pages |
|
These ares the pages that are available for responsive sizing.
|
Views that can be resized |
Views that can be partially resized |
Views that can't be resized |
|---|---|---|
|
Columns / Sections
|
Ticker - horizontal only |
|