Overview of the Sales Dashboard
A sales dashboard is a visual representation of key sales performance metrics and KPIs (Key Performance Indicators) designed to provide a quick and easy-to-understand overview of a sales team's performance.
Salespeople and sales managers can use the Sales Dashboard to review items that need their immediate attention, including upcoming appointments and tasks. The dashboard can also display tables of information and visualizations from OTBI and from shared saved searches.
Oracle delivers two Sales Dashboards: one for the sales representative and one for the sales manager.
As an administrator, you can use Oracle Visual Builder Studio to configure each version of the Sales Dashboard to meet your requirements.
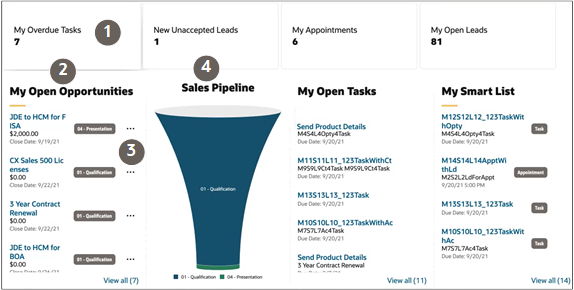
Here's an example of what a salesperson sees in the Sales Dashboard provided by Oracle:
- The tiles at the top of the page, called Metric Cards (or Attention Tiles), display the number of important work items in the list generated from a saved search. For example, the My Overdue Tasks tile shows the number of overdue tasks a salesperson owns (callout 1 in the screenshot). Clicking on a tile displays the list.
- The bottom section of the salesperson dashboard displays a list or graphical
representations, called visualizations:
- My Open Opportunities (callout 2) lists opportunities that are closing soon. The
list is generated from a saved search with the same name. Salespeople can take an
action on an item in the list by clicking Actions (the
three dot icon, callout 3), or they can click View all to
see the complete list of open opportunities.
The layout of My Open Opportunities and other sections of the Sales Dashboard are saved as templates that you can copy and use to display other saved searches in a similar way.
- Sales Pipeline (callout 4) displays a visualization of a salesperson's pipeline by sales stage. Click the opportunity stages to get a list of opportunities at each stage. The data for the visualization comes from an Oracle Analytics Cloud analysis.
- My List shows accounts, contacts, leads, and opportunities that were recently accessed by the salesperson or are associated with an activity. Items accessed more often get higher priority on the list.
- My Open Opportunities (callout 2) lists opportunities that are closing soon. The
list is generated from a saved search with the same name. Salespeople can take an
action on an item in the list by clicking Actions (the
three dot icon, callout 3), or they can click View all to
see the complete list of open opportunities.

What You Can Modify
The Sales Dashboard displays content in individual sections, or logical regions of the page. Each section maps to a template, which defines the content displayed within that section.
In VB Studio, there are four types of templates you can use to display both preconfigured and custom saved searches:
Attention Tile (also called a Metric Card)
A tile that displays the name of the saved search and the number of items in the list of results. Clicking on the tile displays the list.-
List
Displays data as a single-column a list.
-
Table
Displays data in a table with multiple columns.
- Visualizations
Displays data as a visualization.
To display visualizations created from saved searches and reports, you use the Chart template type.
Digital Sales delivers a predefined set of visualizations that you can add to a dashboard. Or you can create your own custom visualizations using the Visualization Configurations page. See the topic Create a Visualization of a Saved Search or an Analysis. (You can add the same visualizations to both the Sales Dashboard and to CX Sales Mobile layouts.)
For each dashboard, you can:
-
Add and remove existing templates, and change their display order.
-
Create new templates.
-
Add visualizations you created from saved searches or from Oracle Analytics Cloud analyses.
Sales Representative and Sales Manager Dashboards
Let's look at the templates that are preconfigured for each version of the Sales Dashboard.
The dashboard for the sales representative includes these templates:
-
Attention Tile for Sales Representative
-
My Appointments Table
-
My Open Opportunities List
-
Sales Pipeline Chart
-
My Open Tasks List
-
My List
The dashboard for the sales manager includes these templates:
-
Attention Tile for Sales Manager
-
My Appointments Table
-
All Opportunities List
-
My Team's Pipeline Chart
-
My Team's Performance Chart
-
My Team's Deal Size Chart
Digital Sales also delivers a default Sales Dashboard. If the user isn't a sales representative or sales manager with the right roles, then the default Sales Dashboard displays at runtime. The default dashboard includes these templates:
-
Attention Tile for Sales Representative
-
My Appointments Table
-
My Open Leads List
-
Sales Pipeline Chart
-
My Open Tasks List
-
My List
Complete List of Sales Dashboard Templates
Digital Sales delivers the below templates already configured for the Sales Dashboard. You can add these templates to any custom Sales Dashboard layout.
| Template Type | Template Name |
|---|---|
| Attention Tile |
|
| Lists |
|
| Table |
|
| Visualizations |
|