Create a Visualization of a Saved Search or an Analysis
You can create a visualization of a saved search or an Oracle Analytics Cloud analysis, which you can then display in the Sales Dashboard and in the CX Sales Mobile app.
You must be a setup user or a user with one of the following job roles to create a visualization:
- ORA_ZCA_CUSTOMER_RELATIONSHIP_MANAGEMENT_APPLICATION_ADMINISTRATOR_JOB (Customer Relationship Management Administrator)
- ORA_ZBS_SALES_ADMINISTRATOR_JOB (Sales Administrator)
- Navigate to and search for ZCA_VIEW_DATA_VISUALIZATION_CONFIGURATION_PRIV (make sure that enabled all role types and privileges in the search filters).
-
From the Expand Toward list, select Users.
-
From the Show list, select Users to see which users have the privilege and from what role.
-
To add the privilege, edit the custom role:
- Go to and search for privilege ZCA_VIEW_DATA_VISUALIZATION_CONFIGURATION_PRIV.
- Add the privilege to the role.
- Save.
How to Create a Configuration Visualization from a Saved Search
You must make sure that the saved search is visible both to the user performing configurations and to the users who will view the visualization.
- Navigate to .
- Click Visualization Configuration in the right-hand pane.
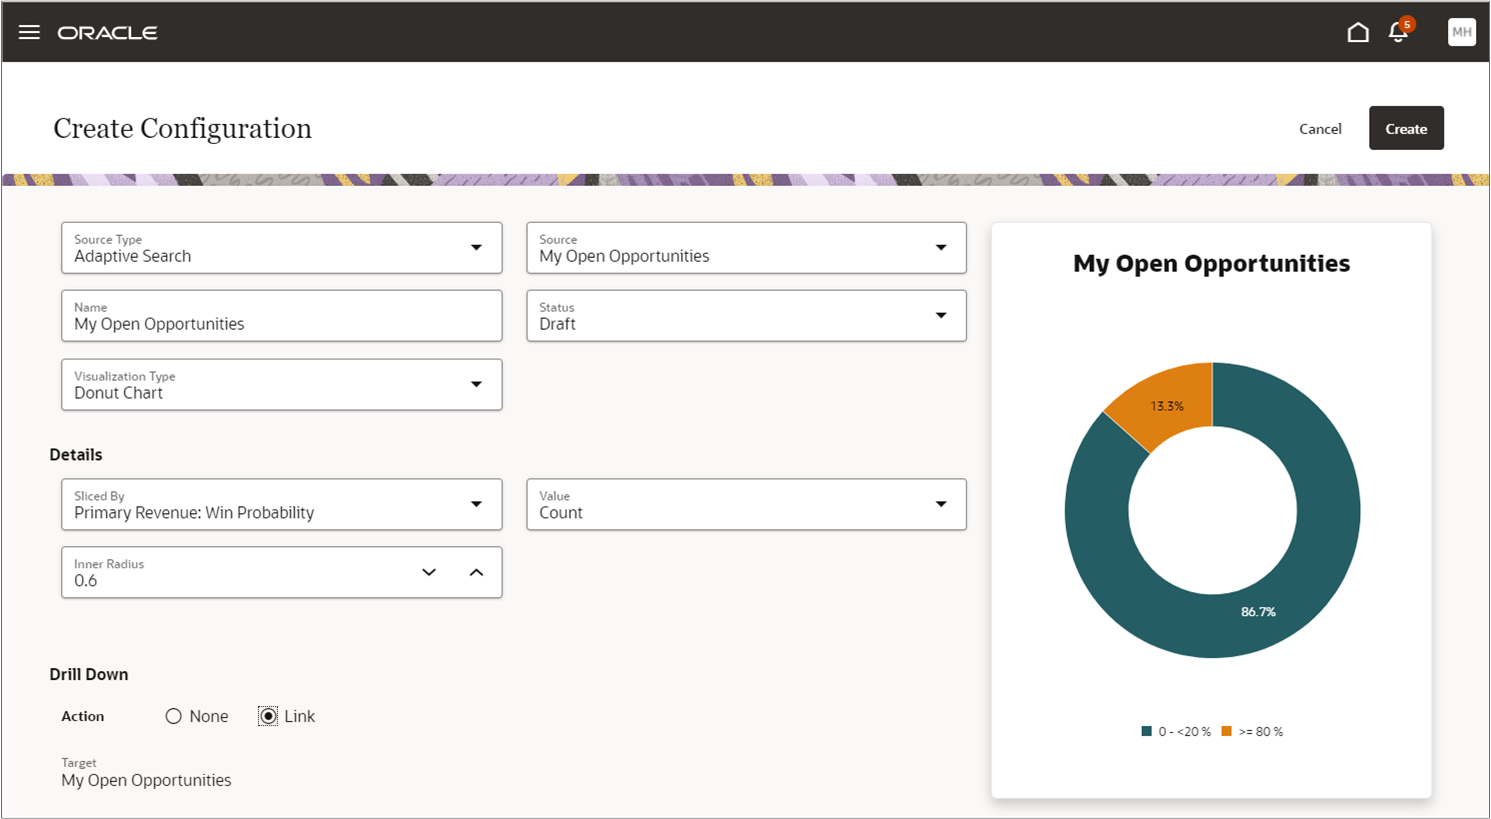
Select the Adaptive Search source type from the Create Configuration page.
-
In the Visualization Configurations page, click Add.
-
In the Source Type field, select Adaptive Search.
-
In the Source field, select the saved search. The saved search is used as the data source for the visualization.
-
In the Visualization Type field, choose your preferred visualization, such as a bar chart, donut chart, and so on.
-
In the Details section, enter the dimensions and other preferences for the visualization.
-
In the Drill Down section, change the Action option from None to Link. This enables drill down to the search list.
-
Set the Status field to Active.
- Click Create to save the configuration.
You can now add this visualization to a Sales Dashboard Add a Visualization to the Sales Dashboard, or to the mobile dashboard using Mobile Application Setup under Application Composer. Configure the Reports Page Layouts
You can also display the saved search visualization on the CX Sales Mobile application Home page as a card. See the topic: Display Visualizations from Saved Searches in Home Page Cards and the Reports List.
How to Create a Visualization Configuration from an Analysis
- Navigate to .
- Click Visualization Configuration in the right-hand pane.
- Click Add to create a new configuration. The Create Configuration page displays the source type and source.
- To create a configuration based upon an OTBI Analysis:
- Select OTBI Analysis as Source Type.
Select a folder by clicking on the catalog icon and navigate to where you have saved the OTBI Analysis. By default, the Custom folder is selected.
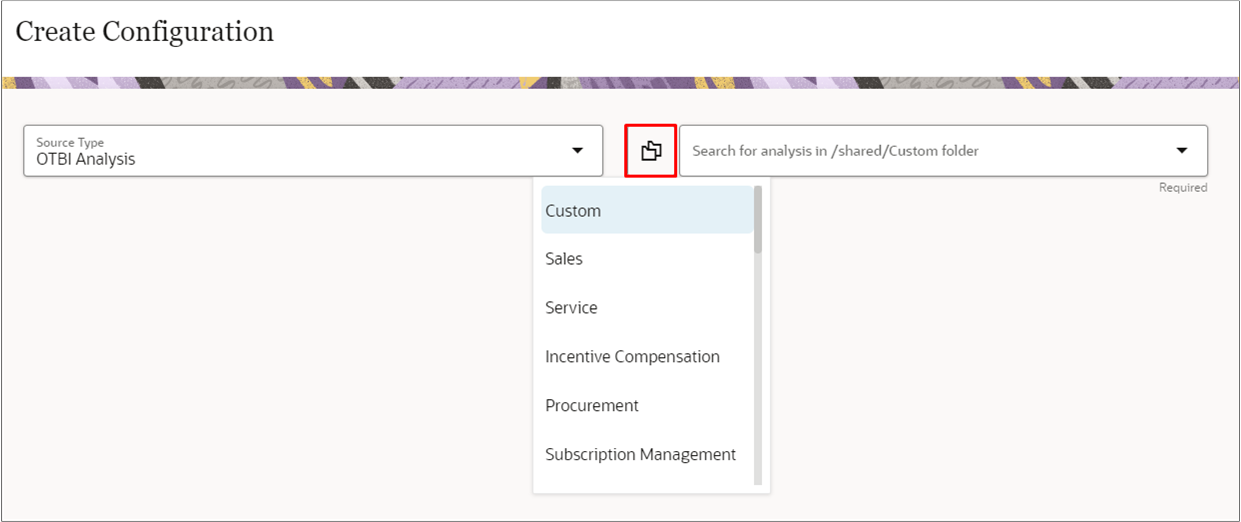
- In the Source field, enter your search criteria. You're searching the catalog for an existing analysis under the selected catalog folder.
- Select a source analysis from the search results. All the fields get auto-selected and the visualization shows on the page. If the selected source analysis has more columns than required, there could be a warning message that the visualization might not show the correct data. To resolve this issue, remove the columns that are not used, and reload the configuration.
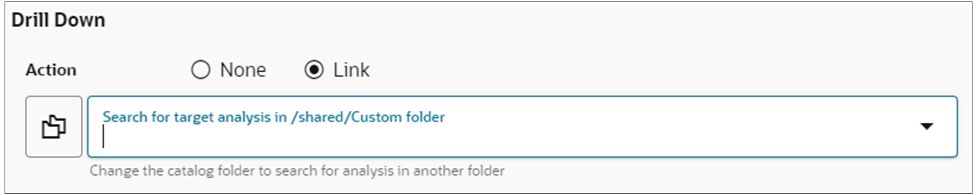
- For the Sales Dashboard only, if you want to enable drill-down functionality,
you need to take a few more steps.
- Select a folder by clicking on the Select Catalog folder icon where you have saved the Target OTBI Analysis.
In the Target field, enter your search criteria. You're searching the BI catalog for an existing target analysis under the selected catalog folder. The target analysis should have a prompted filter applied on the same field as selected in the source analysis. The target analysis opens in a new window showing the drilled-down report. If you want to create a configuration using a predefined or seeded BI Analysis, you should select the Catalog folder as Sales and then search for the source.
- After enabling drill-down, you can validate the drill-down functionality by clicking on any component of the visualization.
- Click Create to save the configuration.
After enabling drill-down, you can validate functionality by clicking on any component of the visualization.