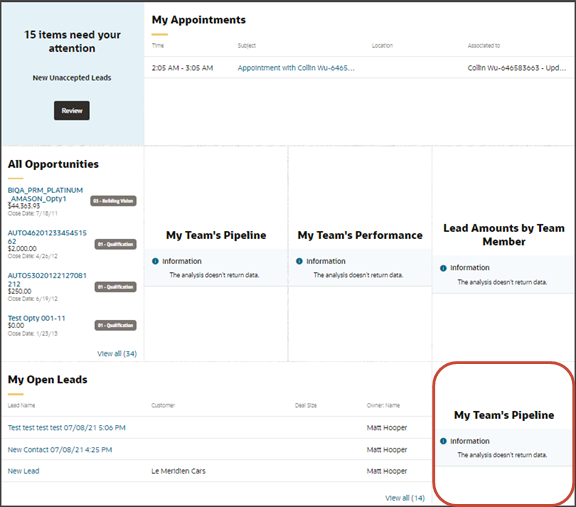
Add a Visualization to the Sales Dashboard
You can add visualizations of saved searches or for Oracle Analytics Cloud analyses. Digital Sales (Next Gen Sales) delivers a set of predefined visualizations, or you can configure custom visualizations using the Visualization Configurations page. This topic walks you through how to add both predefined and custom visualizations to the Sales Dashboard.
Predefined Visualizations
Digital Sales includes these predefined visualizations which you can add to a Sales Dashboard layout where needed:
-
My Earnings by Period
-
My Team's Deal Size Chart
-
My Team's Leads Size Chart
-
My Team's Performance Chart
-
My Team's Pipeline Chart
-
Sales Pipeline Chart
-
Template for Chart
To create your own visualizations, follow the instructions in the topic Create a Visualization of a Saved Search or an Analysis.
Prerequisites
Before you start you must create a copy of the sales dashboard layout in Visual Builder Studio. See Duplicate the Predefined Sales Dashboard Layout for details.
Add a Predefined Visualization to the Sales Dashboard
-
In the copy of the layout, for example, Manager (Copy), review the layout's condition to ensure that the correct role is specified for this layout.
-
You're now ready to add a predefined visualization to your copy of the Sales Dashboard. In this example, we're adding the Sales Pipeline Chart to the Sales Dashboard for sales managers.
On the Properties pane for the Manager (Copy) layout, click the + Add Section icon.
-
Click Sales Pipeline Chart.
The newly added Sales Pipeline Chart is added at the bottom of the layout. You can change the order the sections are displayed. Just use the Move Up and Move Down arrows in the Sections region.
-
Click the Preview button to see your changes in your runtime test environment.

Add a Custom Visualization to the Sales Dashboard
If you previously created your own visualizations using the Visualization Configurations page, then you can add them to any Sales Dashboard layout:
-
In the copy of the Sales Dashboard layout, for example, Manager (Copy), review the layout's condition to ensure that the correct role is specified for this layout.
-
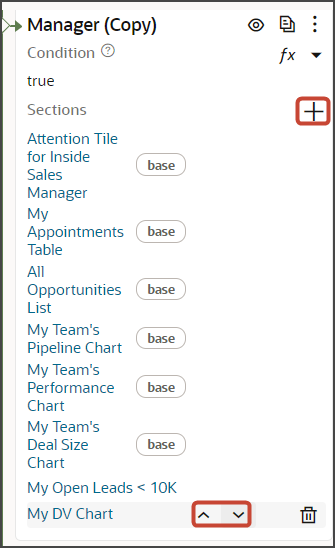
On the Properties pane for the Manager (Copy) layout, click the + Add Section icon > + New Section.
In the Create Section dialog, in the Title field, enter a section title, such as My DV Chart, then click OK.
Note: The title is the name of the section, not how the section will appear at runtime on the dashboard. The runtime title comes from the chart-title field which you set later in this procedure.The newly added section is added to the bottom of the layout. You can change the order the sections are displayed. Just use the Move Up and Move Down arrows in the Sections region:
-
Click My DV Chart.
The template editor opens.
-
Click the Code button.

All custom sections that you've created for this dynamic container, if any, display in the editor.
Your new My DV Chart section displays at the bottom with empty placeholder
templatetags.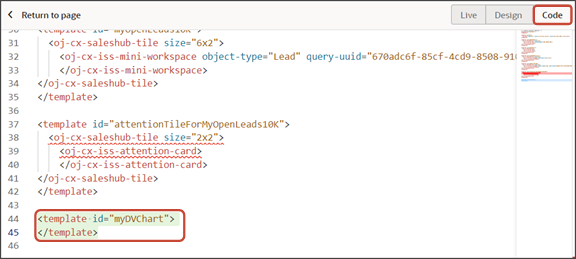
-
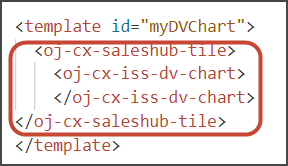
For a visualization, enter this code between the existing placeholder
templatetags.<oj-cx-saleshub-tile> <oj-cx-iss-dv-chart> </oj-cx-iss-dv-chart> </oj-cx-saleshub-tile>Here's a screenshot of the new template code for a visualization:
-
Click the Design button.

-
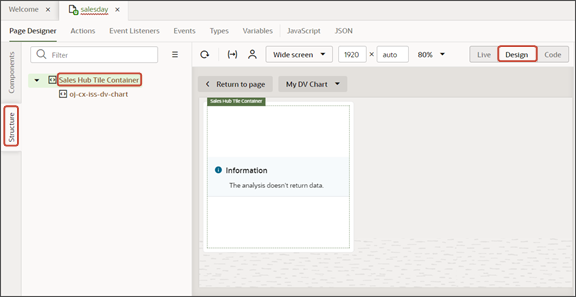
On the Structure pane, click Sales Hub Tile Container.
-
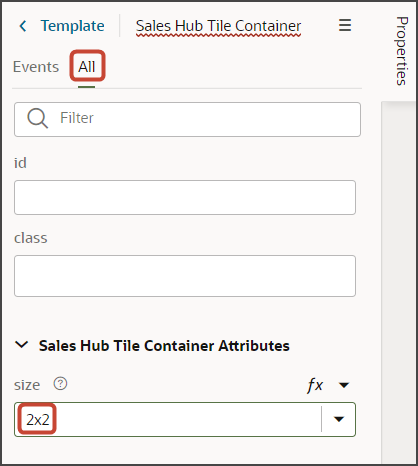
On the Properties pane, on the All tab, select 2x2 as the size.
-
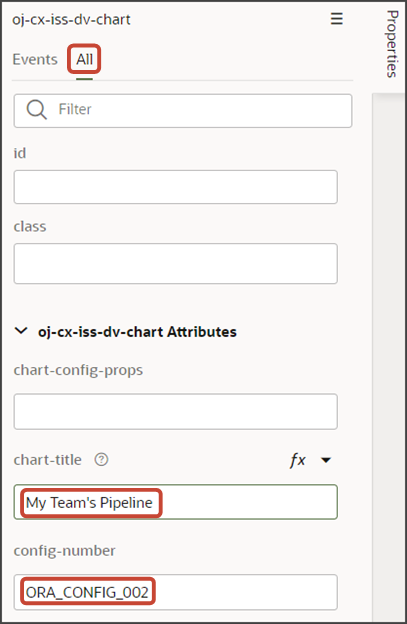
Still on the Structure pane, click oj-cx-iss-dv-chart.
-
On the Properties pane, in the Title field, enter
My Team's Pipeline. -
In the Configuration Number field, enter the reference number of the visualization that you previously created on the Visualization Configurations page.
For more information about creating visualizations, see Create a Visualization of a Saved Search or an Analysis. (Visualizations can be added to both CX Sales Mobile layouts as well as Sales Dashboard layouts.)
-
Click the Preview button to see your changes in your runtime test environment.

