Configure Metric Card Badges and Descriptions
You can configure metric cards so that different badges and descriptions display depending on certain conditions. For example, if a metric card displays 10 open leads, then maybe you'd like the warning badge to display. But if there are only 2 open leads, then maybe you don't want a badge to display at all. You do this configuration in Oracle Visual Builder Studio.
Prerequisites
A metric card displays data from a saved search. Before you add a metric card to the Sales Dashboard and configure it, you must:
-
Create the saved search
-
Share the saved search with the appropriate job role
Capture the UUID of the saved search from the URL on the list page. Here's a screenshot showing the location of the UUID when you display the saved search.

-
Create a copy of the Sales Dashboard layout where you want to add the metric card. See the topic Duplicate the Predefined Sales Dashboard Layout for details.
Overview of Setup Tasks
-
Add a metric card region to the layout.
-
Specify the metric cards to display inside the region.
-
For each metric card, modify the card's badge properties:
-
Specify the badge type and its display text.
-
Specify the conditions when you want each badge type to display.
-
Add description text, if needed.
-
Example of Metric Card Conditions
To configure badges and descriptions on a metric card, you first determine the display conditions. Each condition is a range of aggregate sum numbers that display on the metric card. For each range, you decide which type of badge and description to display. For example, you can configure this type of setup:
-
If fewer than 5 overdue tasks exist, then don't show a badge at all.
-
If 5-10 overdue tasks exist, then show a warning badge.
-
If more than 10 overdue tasks exist, then show a critical badge and a description.
You can also configure the metric card so that the card always displays the same badge or description regardless of the aggregate sum on the card.
This setup is optional. If you skip this setup for a metric card, then no badges or descriptions will ever display on the card.
Sequence of Conditions
When you define the display conditions for a metric card, the order of those conditions is important. Each condition is evaluated in the order in which you define them, from top to bottom. Whichever condition is satisfied first is the condition that's applied.
Badge Properties: Sample Format
For each metric card, the badge properties that you define must always follow a specific format. Here's a sample of the required format. In this sample, there's only 1 UUID which means that there's only 1 metric card.
saved-searches-list="[[ [
      {
        queryUuid: '5141f8ab-3aa8-4c0e-adf8-0b3ebb3218ac',
        badgeProp: [
          {badgeStatus:'success', lowerLimit: 0,upperLimit: 3, badgeText: 'All OK'},
          {badgeStatus:'warning', lowerLimit: 4, upperLimit: 5, badgeText: 'Please Check'},
          {badgeStatus:'danger', lowerLimit: 6, badgeText: 'Problem'}
        ]
      }
] ]]"| Badge Property | Description |
|---|---|
|
badgeStatus |
Each type of badge (badgeStatus) displays with a specific color, which you can't change. Here's an example of several badges and colors:  |
|
lowerLimit |
Lower limit of the display condition for a specific badgeStatus. |
|
upperLimit |
Upper limit of the display condition for a specific badgeStatus. |
|
badgeText |
Text that appears on the badge. Each type of badge (badgeStatus) displays with default text, but you can use this property to change it. |
|
metaText |
Text description for the metric card. |
Configure Badge Properties
To configure badges and descriptions for a metric card:
From the Sales Dashboard, enter into Oracle Visual Builder Studio. Under the Settings and Actions menu, select Edit Page in Visual Builder Studio.
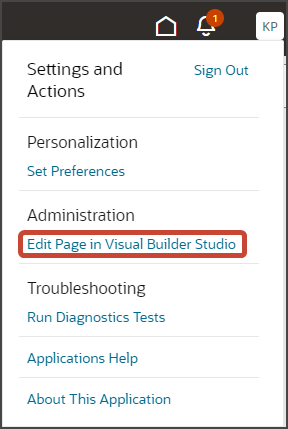
You should be on the salesday tab in Page Designer.
-
Duplicate a Sales Dashboard layout, for example, duplicate the Manager layout and accept the default name, Manager (Copy).
See "Duplicate the Predefined Sales Dashboard Layout."
On the Properties pane for the Manager (Copy) layout, click the + Add Section icon > + New Section.
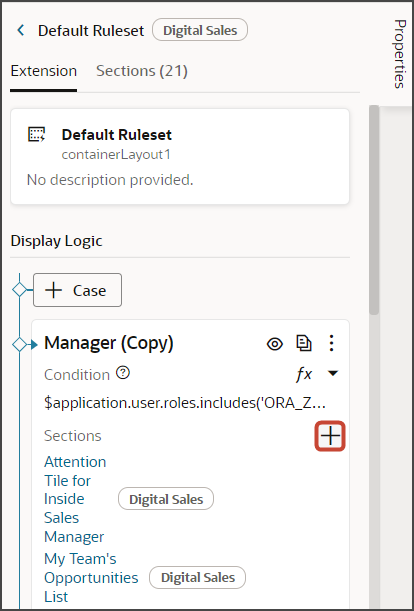
In the Create Section dialog, in the Title field, enter a section title, such as NewMetricSection, then click OK.
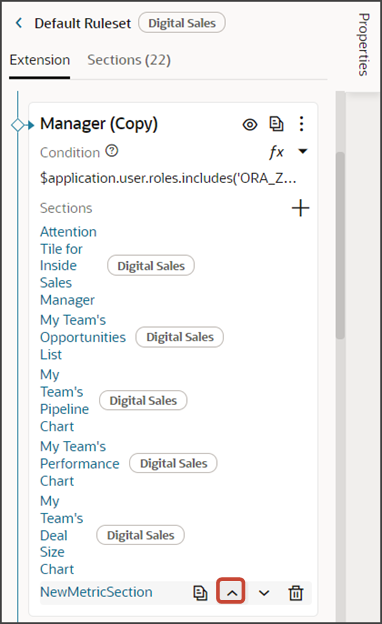
The newly added section is added to the bottom of the layout. Use the Move Up arrow to move the new section to the top of the layout.
Delete the existing Attention Tile for Sales Manager section.
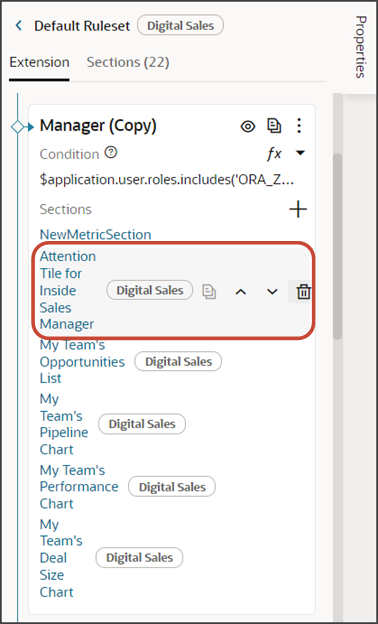
-
Click the NewMetricSection link.
The template editor opens.
-
Click the Code button.

The NewMetricSection template displays with empty placeholder
templatetags.
-
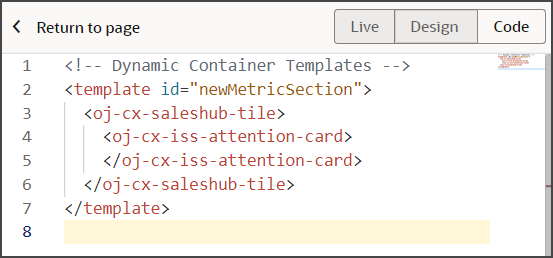
To add a new metric card region to the dashboard layout, enter this code between the existing placeholder
templatetags.<oj-cx-saleshub-tile> <oj-cx-iss-attention-card> </oj-cx-iss-attention-card> </oj-cx-saleshub-tile>Here's a screenshot of the new template code for a metric card:
-
Click the Design button.

-
On the Structure pane, click Sales Hub Tile Container.
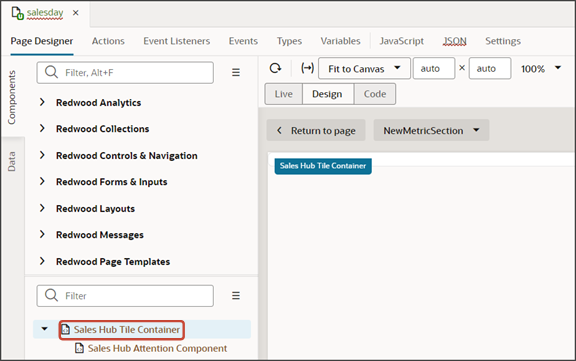
-
On the Properties pane, on the All tab, enter 8x1 as the size.
-
Still on the Structure pane, click Sales Hub Attention Component.
-
Click the Code button.
-
Add this placeholder code inside the oj-cx-iss-attention-card opening tag:
saved-searches-list="[[ [
      {
        queryUuid: '5141f8ab-3aa8-4c0e-adf8-0b3ebb3218ac',
        badgeProp: [
          {badgeStatus:'success', lowerLimit: 0,upperLimit: 3, badgeText: 'All OK'},
          {badgeStatus:'warning', lowerLimit: 4, upperLimit: 5, badgeText: 'Please Check'},
          {badgeStatus:'danger', lowerLimit: 6, badgeText: 'Problem'}
        ]
      },
      {
        queryUuid: 'b803d9db-8b59-44b9-8968-f3525ae62882',
        badgeProp: [
          {badgeStatus:'success', lower: 25, Upper: 35, badgeText: 'All OK'},
          {badgeStatus:'info', upper: 24, badgeText: 'Track'}
        ]
      }
      ] ]]"
In the above sample, there are 2 UUIDs. The UUID refers to the unique identifier of each saved search that populates a metric card. Each UUID represents a single metric card.
Copy and paste the placeholder code to meet the number of metric cards you want to add to this region. For optimal viewing, 6 or 7 metric cards is a good maximum number to include in this region.
- Once you've adjusted the code with the number of UUIDs (metric cards) you need, you can now update the rest of the code.
-
For each metric card, replace the sample UUIDs with the correct UUIDs of your saved searches.
-
For each UUID, optionally configure a badge properties section:
-
Specify the type of badge to display.
-
Define the conditions (upper and lower limits) under which each badge (and optionally a description) will display.
-
Optionally indicate the badge text. For example, does the text say Warning or Problem?
-
Optionally specify a description.
Tips:
-
You can specify only a lower limit without an upper limit (to indicate an aggregate sum that's greater than 10, for example).
-
You can add metaText without any range conditions. So, if none of the ranges apply, then show a description on the metric card.
-
If you don't want to display a badge or description at all, then just add the queryUUIDs. For example:
saved-searches-list="[[ [
      {
        queryUuid: '5141f8ab-3aa8-4c0e-adf8-0b3ebb3218ac'
      },
      {
        queryUuid: 'b803d9db-8b59-44b9-8968-f3525ae62882'
      }
      ] ]]"
-
Note: The code that you add to the template editor displays in the List of Saved Searches field on the Properties pane.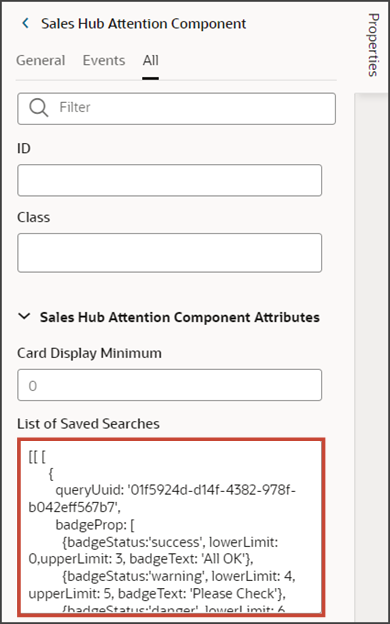
-
-
Click the Preview button to see your changes in your runtime test environment.
