Sales Dashboard
Use the Sales Dashboard to search through all of your sales information, review sales trends, and stay informed on the key details for your day. The details can include pipeline, upcoming appointments, and overdue tasks. What information you see depends on your role in the sales organization and your data permissions. Sales administrators can create different sales dashboards for different roles.
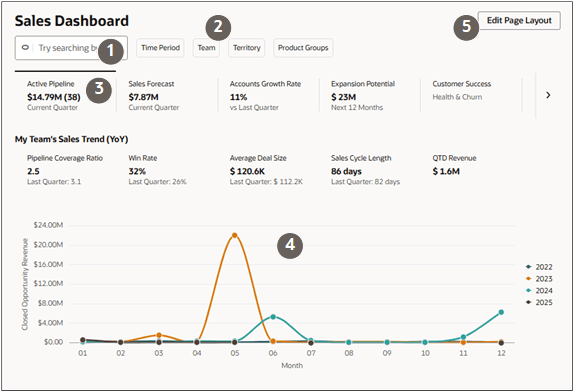
Here's a screenshot of a sales dashboard annotated to highlight key features:
| Callout | Feature | Feature Description |
|---|---|---|
| 1 | Ask Oracle bar |
Use the Ask Oracle bar to:
|
| 2 | Dashboard filters |
Filter the content of the selected sales dashboard tab. These filters filter the dashboard contents only. They don't affect your global keyword search. |
| 3 | Dashboard tabs | Sales dashboard is made up of tabs. A tab may include summary key performance information at the top of the tab that's always visible. |
| 4 | Graphics and tables |
The tab contents can display up to 5 interactive tables and charts from a variety of sources including Express Reports, Saved Searches, Oracle BI analytics. |
| 5 | Edit Page Layout button | If you see the button, then you can edit the sales dashboard and personalize the layout. You can even create your own reports using Express Reports or using the visualization AI agent. See the topic View and Manage Express Reports |