Embed Content Created in Oracle Fusion Data Intelligence
Here's how you can embed content created in Oracle Fusion Data Intelligence.
Here's an example of the type of content you can embed:
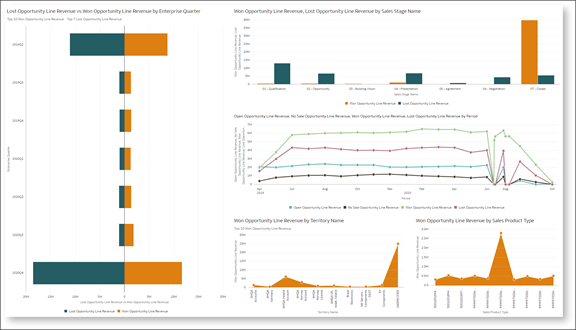
For more information about the Oracle Fusion Data Intelligence embedding framework, see the Visualizing Data and Building Reports in Oracle Analytics Cloud guide.
Prerequisites
- You must register your domain as a safe domain. See the topic: Typical Workflow to Use the JavaScript Embedding Framework with Oracle Analytics Content
-
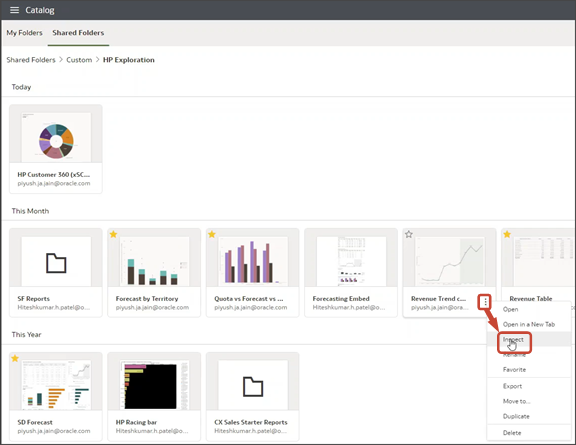
Before adding an Oracle Fusion Data Intelligence (OFDI) component to the Sales Dashboard, you must retrieve the Object ID from your existing OFDI content:
-
Navigate to the OFDI host where the analytics workbook is saved.
-
Click the .
-
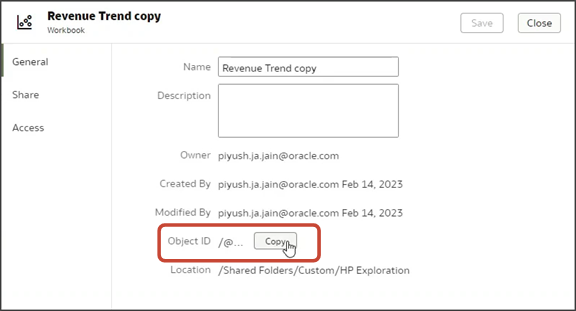
Next to the Object ID, click Copy.
-
Paste the Object ID, along with the Fusion Data Intelligence host URL, into a separate file for later use. For example:
-
Oracle Analytics Host:
https://oac01-gse00010001-px.analytics.ocp.oraclecloud.com/ -
Object ID:
/@Catalog/shared/Custom/HP Exploration/Revenue Trend
                                            copy
-
-
Add an Oracle Fusion Data Intelligence component to the Sales Dashboard
- Display the Sales Dashboard and open the Oracle Visual Builder Studio.
-
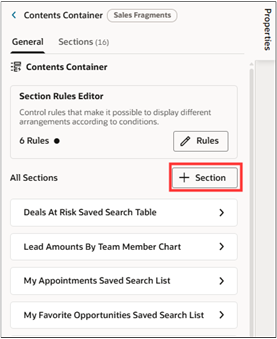
In the Properties pane Components tab, search for and click Contents Container.
On the Contents Container Properties pane, click the + Section button.
-
Select + New Section at the top of the list.
-
In the Properties New Section pane, Title field, enter a title for the visualization component.
Note:The title is the name of the component and doesn't appear on the dashboard at runtime. The runtime title comes from the
dashboardTitleparameter that you add to the visualization code. -
Click the Go to Designer link.
Click the Code button.
Your new Revenue Trend section displays with empty placeholder
templatetags.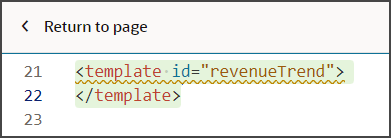
-
Insert the following code between the template tags:
<oj-oa-project host="https://oaxprodmgmtfawdev4-idbe1glbntjz-ia.analytics.ocp.oraclecloud.com"
    project-path="/@Catalog/shared/Custom/HP Exploration/Revenue Table" b-show-filter-bar="false"
    class="oj-flex oracle-cx-fragmentsUI-cx-fragment-full-height" compatibility-mode="yes" active-page="insight">
  </oj-oa-project>
You will need to replace the following values (You can do this in the next step):- The host name
- The project path. This is the link to the report you want to include.
The
b-show-filter-baroption is set to false. No filter bar will be shown in the report.The
active-pageis set to "insight". If the workbook includes multiple pages, the first page will be displayed.The
compatibility-modeis set "yes". This legacy setting allows compatibility with older report versions. -
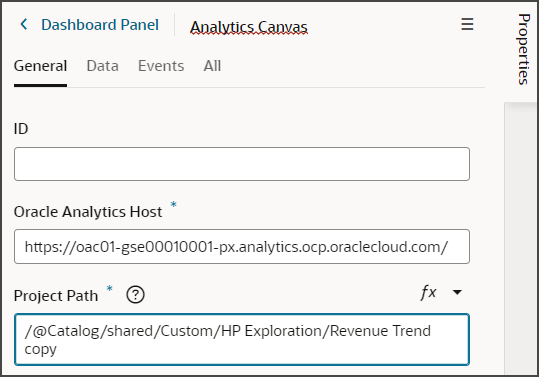
On the Properties pane, in the Host field, enter the host URL that you saved, such as
https://oac01-gse00010001-px.analytics.ocp.oraclecloud.com/. -
In the Project Path field, enter the repository path of the project to render, such as
/@Catalog/shared/Custom/HP Exploration/Revenue Trend copy.Note:This is the Object ID of the Oracle Analytics Cloud workbook that you saved.
-
Now that you've created the dashboard panel component, add it to the appropriate sales dashboard.