Add Code for Visualizations
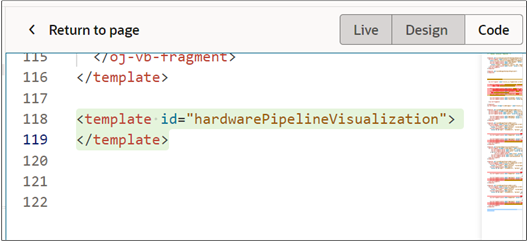
Here's the code that you add between the empty template tags for a section displaying visualizations created using the Visualization Configurations tool or those created using Express Reports.
-
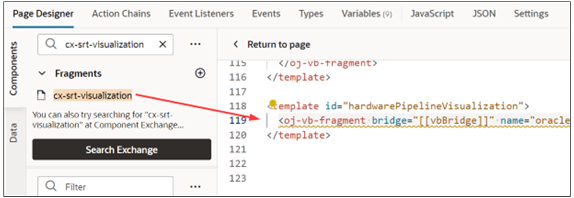
On the Components palette, Filter field, enter
cx-srt-visualization. Drag and drop the cx-srt-visualization fragment to the editor, between the template tags.
-
Add the following class information
class="oj-flex
                        oracle-cx-fragmentsUI-cx-fragment-full-height"
to the <oj-vb-fragment line before the > tag.<oj-vb-fragment bridge="[[vbBridge]]" name="oracle_cx_fragmentsUI:cx-visualization" class="oj-flex oracle-cx-fragmentsUI-cx-fragment-full-height"> -
Add the following fragment parameters to the code below the bridge parameter and before the </oj-vb-fragment> tag.
    <oj-vb-fragment-param name="reportNumber" value="XXXX"></oj-vb-fragment-param>
    <oj-vb-fragment-param name="context" value='{"mode": "dashboard","source":"DV","dashboardTitle":"XXXXX"}'></oj-vb-fragment-param>
    <oj-vb-fragment-param name="filter" value="[[ $base.page.variables.dashboardFilters ]]"></oj-vb-fragment-param>
In your fragment code, replace the values for the
reportNumber,source, anddashboardTitleparameters with the values for your custom visualization.This table describes the key parameters:
Custom Visualization Parameters
Parameter Name
Description
reportNumber
Enter the reference number of the visualization that you created using the Visualization Configuration tool.
You can also display the visualizations created in Express Reports, by entering its report number. The sales dashboard only displays the visualization part of the Express Report. The table isn't displayed.
mode
This value should always be
dashboard.source
Enter
DVfor visualizations you created using the Visualization Configuration tool.To display the visualizations created in Express Reports, enter
SRT.dashboardTitle
Specify the title of the visualization that displays above the chart at runtime.
Here's a finished code sample for a visualization created in the Visualization Configuration tool:
<template id="hardwarePipelineVisualization"> <oj-vb-fragment bridge="[[vbBridge]]" name="oracle_cx_fragmentsUI:cx-visualization" class="oj-flex oracle-cx-fragmentsUI-cx-fragment-full-height"> <oj-vb-fragment-param name="reportNumber" value="4001"></oj-vb-fragment-param> <oj-vb-fragment-param name="context" value='{"mode": "dashboard","source":"DV", "dashboardTitle":"Opportunities by Stage"}'></oj-vb-fragment-param> <oj-vb-fragment-param name="filter" value="[[ $base.page.variables.dashboardFilters ]]"></oj-vb-fragment-param> </oj-vb-fragment> </template> - You're now ready to add the section to the contents container.