Enable Filtering of Information Displayed in the Sales Dashboard
You can enable 4 filters that salespeople can use to filter the information displayed in the sales dashboard: Time Period, Teams, Territory, and Product Groups. When you enable the filters, they're available in all the sales dashboards in your organization.

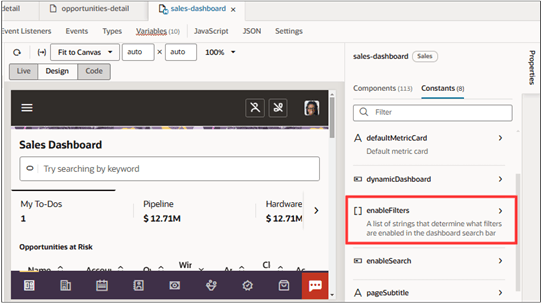
Here's how to display the global filters:
Enable the Filters Using VB Studio
- Open the custom Sales Dashboard where you're adding the filters.
- Click .
- In VB Studio, select the App UIs tab.
- On the Page Designer subtab, click Components.
- On the Properties tab on the right, click Constants.
Click enableFilters.
-
Use the Add Item (plus sign) icon to add rows for each filter you want to display. You can make the filters available to all or restrict them to specific job roles. For example, only managers may need to filter by teams and territories.
Enter the following code to enable filters to all users:
Filter Code to Enable to All Users Time Period timeFilterTeam teamFilterTerritory territoryFilterProduct Groups productGroupFilter
-
To restrict a filter to specific job roles, enter code similar to the following. The sample code below restricts the metric you specify in yourMetric to the sales manager roles provided by Oracle.
[[ $application.user.roles.includes('ORA_ZBS_INSIDE_SALES_MANAGER_JOB') || $application.user.roles.includes('ORA_ZBS_SALES_MANAGER_JOB') ? 'mymetric' : 'yourMetric' ]]
Enable Filters in the OTBI Analyses
You must include "is prompted" column filters in your analyses that match the filters you enable in the dashboard. The following table lists the columns for opportunity pipeline visualizations.
| Filter | Folder | Column | Operator |
|---|---|---|---|
| Team | / | Current Level 1 Resource id | is prompted |
| Territory | Level 1 Territory id | is prompted | |
| Time | Expected Close Date | is prompted | |
| Product Group | Sales Catalog Hierarchy 1 Name | is prompted |
