Create a Table from an OTBI Analysis
Here's how to create a table for the sales dashboard from an OTBI analysis using the Visualization Configuration feature in Application Composer.
Create the Visualization
- Navigate to .
- Click Visualization Configuration in the right-hand pane.
- Click Add to create a new configuration.
-
On the Create Configuration page, select OTBI Analysis as the Source Type.
Click Select Catalog Folder, the folder icon, and select Custom.
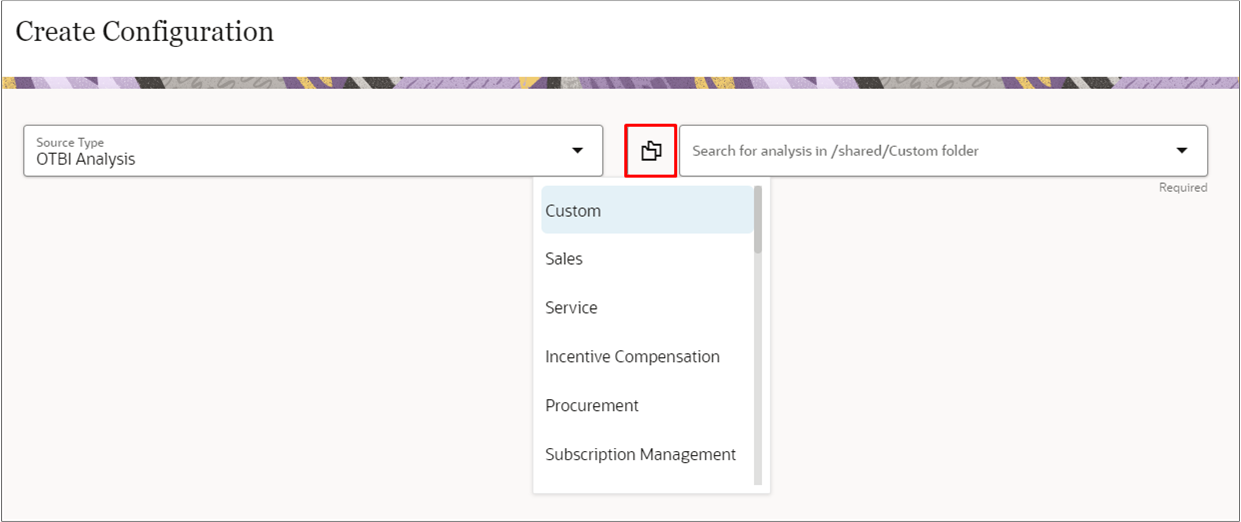
- In the search field, enter the name of your custom analysis.
-
Select the analysis in the search results. All the fields in the analysis are included automatically, and the visualization displays on the page.
- In the Name field, enter the title for the table.
- In the Visualization Type field, select Tabular Chart.
Use the controls in the Columns section to change column order and to hide columns you don't want to display in the table.
Callout Control Description 1 Use the handles to change column order. 2 Click the name link to specify column format (such as currency, decimal, or percentage) and enable drill-down on the field. 3 Hide columns in the table. In this example, we're hiding the Opportunity ID and Opportunity Number columns. These columns are used to identify the record for the drill down in the next step. They aren't meaningful to salespeople. 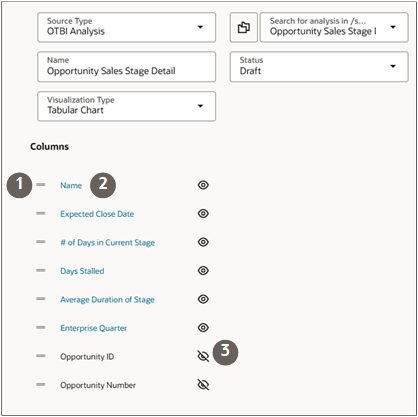
-
Enable drill-down functionality on fields in the table. For example, open an opportunity by clicking on its name:
- Click the Name link.
- On the Preferences drawer, turn on Drill Down.
- In the Page field, select the type of record you're opening. In this example, opportunities.
- In the PUID field, select the number ID for the object. For opportunities this is the Opportunity Number.
- In the ID field, select the object ID field, such
as Opportunity ID.
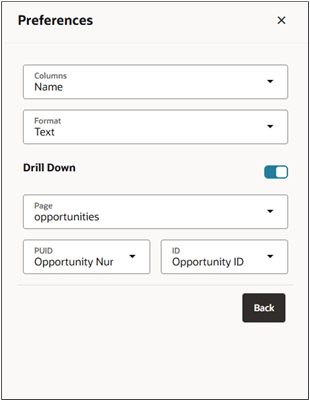
- Click Back.
- You can test the drill-down from the table.
- Set the configuration Status to Active.
- Click Create to save the configuration.
- Note the number of the visualization configuration on the list page. You use this number to reference the visualization in the sales dashboard.