Create Visualization Configurations
You can create a visualization for an OTBI analysis or for a saved search.
You must be a setup user or a user with one of the following job roles to create a visualization:
-
ORA_ZCA_CUSTOMER_RELATIONSHIP_MANAGEMENT_APPLICATION_ADMINISTRATOR_JOB (Customer Relationship Management Administrator)
-
ORA_ZBS_SALES_ADMINISTRATOR_JOB (Sales Administrator)
How to Create a Visualization Configuration From the Catalog
- Navigate to .
- Click Visualization Configuration.
- Click Add to create a new configuration. The Create Configuration page displays the source type and source.
- To create a configuration from an OTBI analysis:
- Select OTBI Analysis as Source Type.
Select a folder by clicking the catalog icon and navigate to where you have saved the OTBI analysis. By default, the Custom folder is selected.
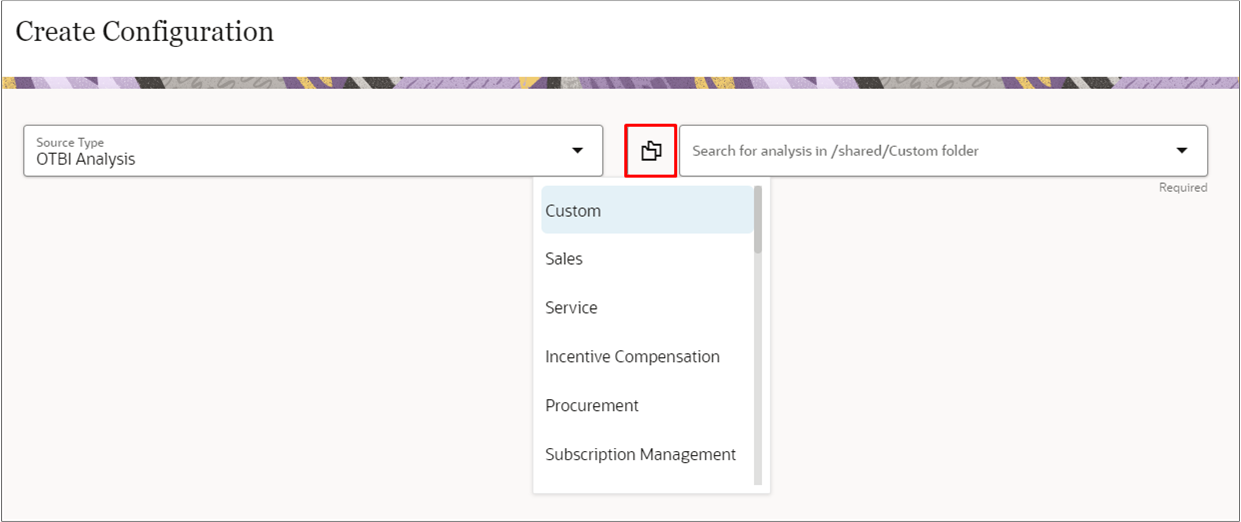
- In the Source field, enter your search criteria. You're searching the catalog for an existing analysis under the selected catalog folder.
- Select a source analysis from the search results. All the fields get auto-selected and the visualization shows on the page. If the selected source analysis has more columns than required, there could be a warning message that the visualization might not show the correct data. To resolve this issue, remove the columns that aren't used and reload the configuration.
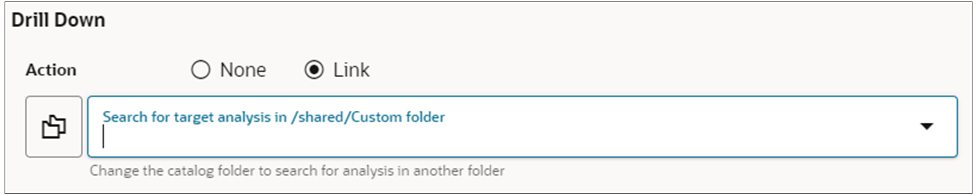
- For the Sales Dashboard only, if you want to enable drill-down functionality, then you
need to take a few more steps:
- Select a folder by clicking the Select Catalog folder icon where you've saved the Target OTBI analysis.
In the Target field, enter your search criteria. You're searching the BI catalog for an existing target analysis from the selected catalog folder. The target analysis should have a prompted filter applied on the same field as selected in the source analysis. The target analysis opens in a new window showing the drilled-down report. If you want to create a configuration using a predefined BI Analysis, then you should select the Catalog folder as Sales and then search for the source.
- After enabling drill-down, you can validate the drill-down functionality by clicking any component of the visualization.
- Click Create to save the configuration.
After enabling drill-down, you can validate functionality by clicking any component of the visualization.
How to Create a Configuration Visualization from a Saved Search
- Navigate to .
- Click Visualization Configuration.
Select the Adaptive Search source type from the Create Configuration page.
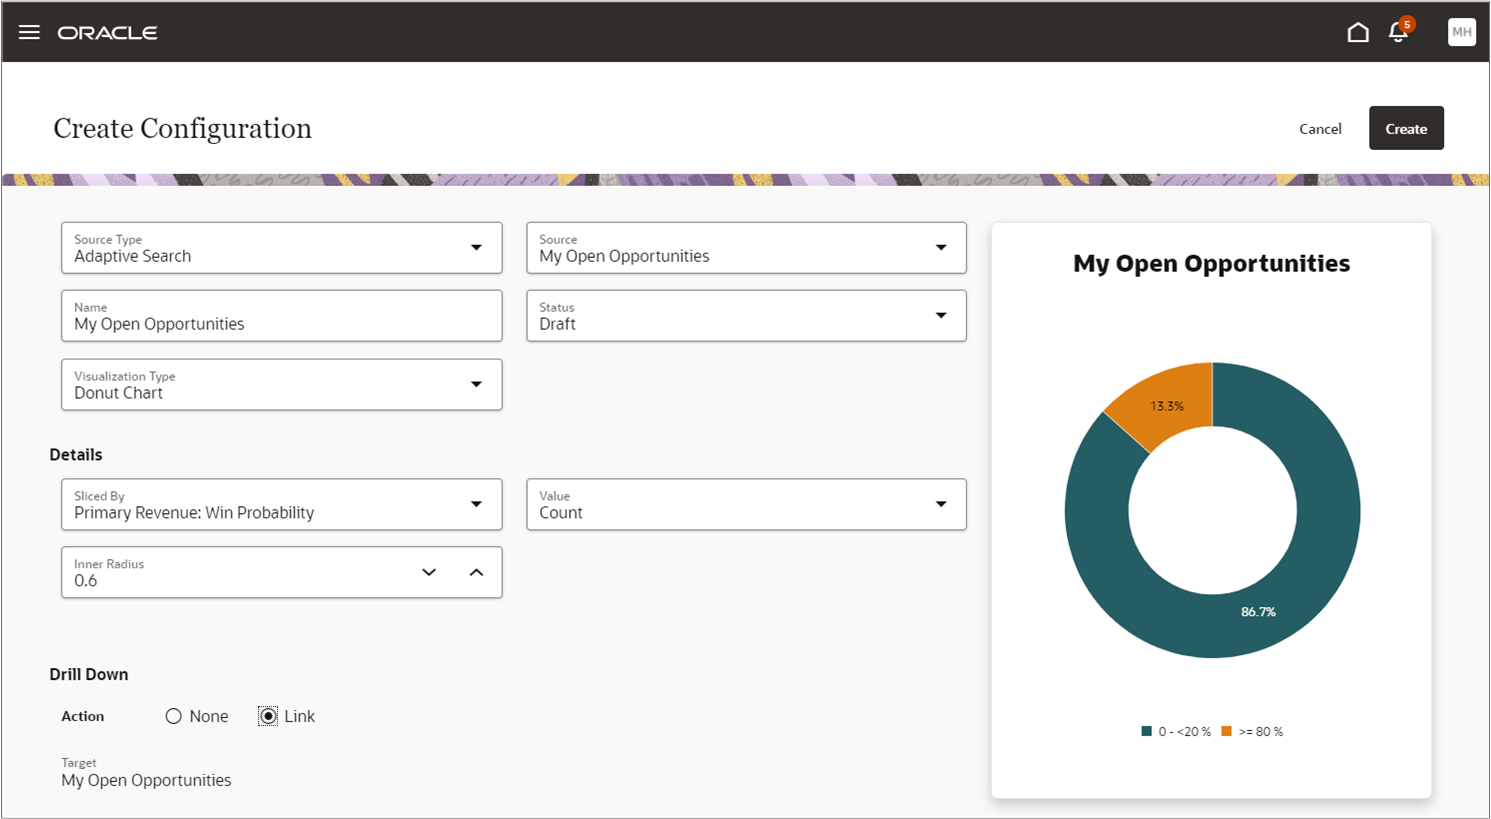
- In the Source Type field, enter your search criteria. You're searching for an existing saved search.
- Select a source analysis from the search results to create your visualization. All the fields get auto-selected and the visualization displays on the right side upon selection.
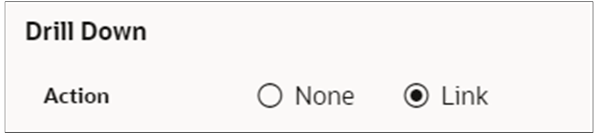
To enable drill-down functionality for the visualization (applicable only for the Sales Dashboard), select the drill-down action as Link.
- After enabling drill-down, you can validate the drill-down functionality by clicking any component of the visualization.
- Click Create to save the configuration.
You can now add this visualization configuration to a Sales Dashboard Add a Visualization to the Redwood Sales Dashboard, or on the mobile dashboard using the Mobile Application Setup in Application Composer. See Configure the Reports Page Layouts.