Add a Visualization to the Redwood Sales Dashboard
You can add visualizations of saved searches or Oracle Analytics Cloud analyses to the Sales Dashboard. You can pick from a set of predefined visualizations, or you can configure custom visualizations using the Visualization Configurations page. This topic illustrates how to add both predefined and custom visualizations to the Sales Dashboard.
Types of Visualizations That You Can Add
You can add both predefined and custom visualizations to the Sales Dashboard:
-
You can add these predefined visualizations:
-
Lead Amounts by Team Member Chart
-
My Team's Performance Chart
-
-
You can add custom visualizations that you create using the Visualization Configurations page.
See Add a Custom Visualization to the Sales Dashboard.
Note: You can also add reports created using the Express Reports tool.For more informaiton about express reporting, contact your Oracle representative.
Prerequisites
-
To add a custom visualization to the Sales Dashboard, you must first create it.
See Create a Visualization of a Saved Search or an Analysis.
-
Sales Dashboard layouts are read only in Visual Builder Studio. To modify a layout, you must first create a copy.
Duplicate the Sales Manager - My ToDo's Content dashboard layout as described in Configure Redwood Sales Dashboard Layouts so that you have a layout that's ready to modify.
Add a Predefined Visualization to the Sales Dashboard
This example illustrates how to add a predefined visualization to the Sales Dashboard for sales managers.
-
On the Properties pane for the Sales Manager - My ToDo's Content (Copy) layout, click the + Add Section icon.
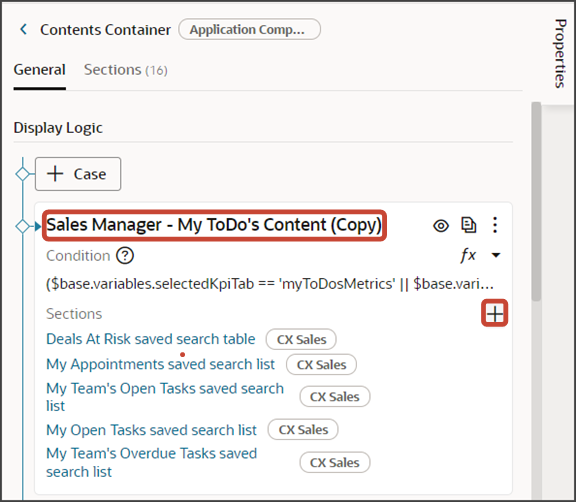
-
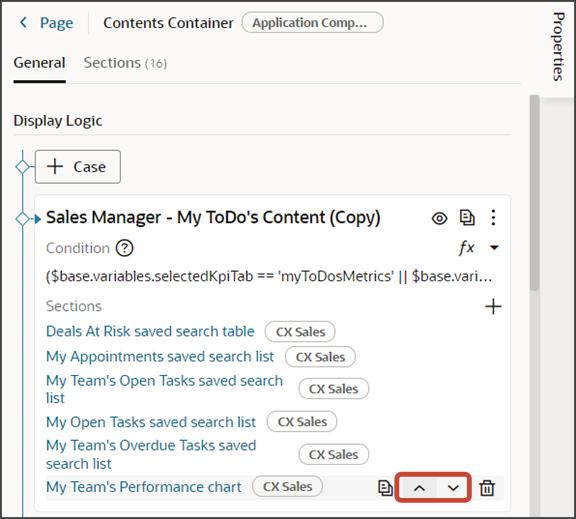
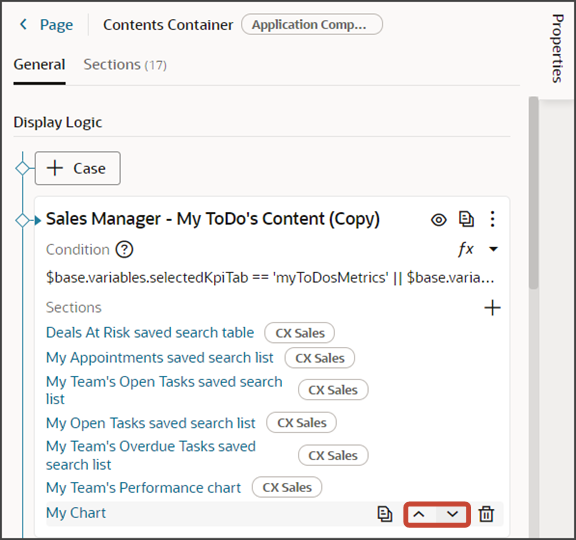
From the list of available components that display, click one of the predefined visualizations, such as My Team's Performance Chart.
The newly added chart is added at the bottom of the layout. You can change the order the sections are displayed by using the Move Up and Move Down arrows in the Sections region.
-
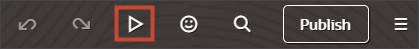
Test the modified dashboard layout by previewing your application extension.
Click the Preview button to see your changes in your runtime test environment.
-
The resulting preview link will be:
https://<servername>/fscmUI/redwood/cx-sales/dashboards/sales-dashboard Change the preview link as follows:
https://<servername>/fscmUI/redwood/cx-sales/application/container/dashboards/sales-dashboard
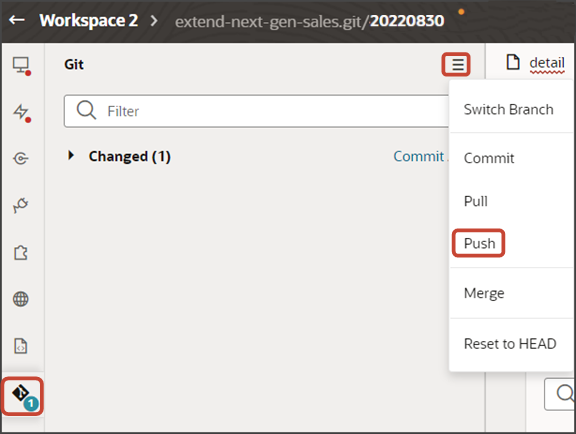
Save your work by using the Push Git command.
Navigate to the Git tab, review your changes, and do a Git push (which does both a commit and a push to the Git repository).
Add a Custom Visualization to the Sales Dashboard
If you previously created your own visualizations using the Visualization Configurations page, then you can add them to any Sales Dashboard layout:
-
On the Properties pane for the Sales Manager - My ToDo's Content (Copy) layout, click the + Add Section icon > + New Section.
-
In the Create Section dialog, in the Title field, enter
My
                            Chart
, and click OK.Note: The title is the name of the component, not how the component will appear at runtime on the dashboard. The runtime title comes from thedashboardTitleparameter that you add to the visualization fragment. See step 7.The newly added section is added to the bottom of the layout. Use the Move Up arrow to move the new section to the desired location.
-
Click the My Chart link.
The template editor opens.
-
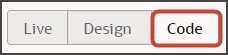
Click the Code button.
Your new My Chart section displays with empty placeholder
templatetags.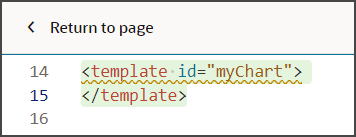
-
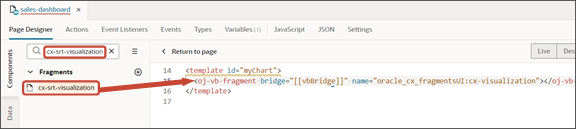
On the Components palette, in the Filter field, enter
cx-srt-visualization. -
Drag and drop the cx-srt-visualization fragment to the template editor, between the template tags.
-
Add the following parameters to the fragment code so that the code looks like the below sample:
<template id="myChart">
    <oj-vb-fragment name="oracle_cx_fragmentsUI:cx-visualization" class="oj-flex oracle-cx-fragmentsUI-cx-fragment-full-height" bridge="[[vbBridge]]">
    <oj-vb-fragment-param name="reportNumber" value="CDRM_1"></oj-vb-fragment-param>
    <oj-vb-fragment-param name="context" value='{"mode": "dashboard","source":"DV","dashboardTitle":"DV Adaptive Chart"}'></oj-vb-fragment-param>
  </oj-vb-fragment>
</template>
In your fragment code, be sure to replace the values for the
reportNumber,source, anddashboardTitleparameters with the appropriate values for your custom visualization.This table describes some of the parameters that you can provide for a custom visualization.
Parameters for a Custom Visualization
Parameter Name
Description
reportNumber
Enter the reference number of the visualization that you previously created.
mode
This value should always be
dashboard.source
Enter either
DVorSRT.SRTrefers to reports created using the Express Reports tool. Contact your Oracle representative for more information.DV charts are charts that you created on the Visualization Configurations page.
dashboardTitle
Specify the title of the chart. This title displays on the dashboard at runtime.
-
Test the modified dashboard layout by previewing your application extension.
Click the Preview button to see your changes in your runtime test environment.
-
The resulting preview link will be:
https://<servername>/fscmUI/redwood/cx-sales/dashboards/sales-dashboard Change the preview link as follows:
https://<servername>/fscmUI/redwood/cx-sales/application/container/dashboards/sales-dashboard
Save your work by using the Push Git command.
Navigate to the Git tab, review your changes, and do a Git push (which does both a commit and a push to the Git repository).