Create the Metric Card the Quick Way: As a Visualization Configuration
You can speed up the creation of a metric card when you create it as a visualization configuration. This method provides a UI for several technical steps, including the creation of badges.
Create the Visualization
-
Make sure that the data you're using is visible to the user performing this configuration. You can temporarily remove filters.
- Navigate to .
- Click Visualization Configuration in the right-hand pane.
-
In the Visualization Configurations page, click Add.
-
From the Create Configuration page, Source Type field, select the Adaptive Search or OTBI Analysis, depending on the source of your data.
- If you selected Adaptive Search as the source type,
then:
- Select the object.
In the Saved Search field, then select Default or a specific saved search.
Selecting Default uses the default saved search for that object as your starting point and permits you to change the filters in the Filters region.

- If you selected OTBI Analysis, then search for the analysis by name. By default, the application searches the Custom folder, but you can change the folder using the Folders button.
-
In the Visualization Type field, select Metric Card.
- In the Name field, enter the title of the tab you're creating.
-
In the Details section, Primary Metric field, select the type of information you want to summarize under the title. For example, to display opportunity revenue, select Primary Revenue: Amount.
- Click the Preferences button (broken vertical lines icon).
- In the Format field, select how you want the data to be represented. For revenue, select Currency to display the currency symbol.
In the Aggregation field, select the calculation type. For revenue, select Sum, for example.
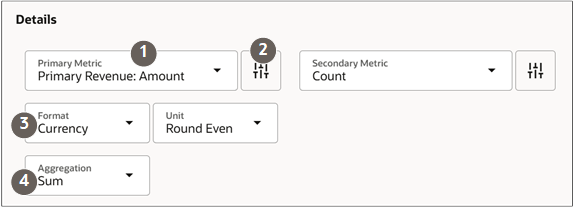
- Repeat the same entries for any Secondary Metric. The secondary metric is the number which appears in parentheses next to the primary metric. For opportunity revenue, you may want to display the number of opportunities by selecting Count, for example.
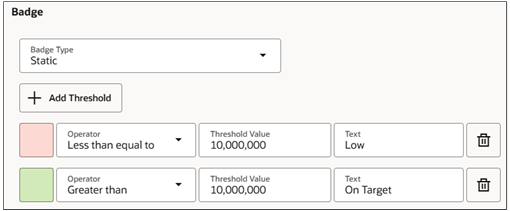
In the Badge section, specify the badges and the ranges of values that display them:
For example, you can configure these badges for tasks:
-
If fewer than 5 overdue tasks exist, then don't show a badge at all.
-
If 5-10 overdue tasks exist, then show a warning badge.
-
If more than 10 overdue tasks exist, then show a critical badge.
The order of the conditions is important. Each condition is evaluated in the order in which you define them, from top to bottom. Whichever condition is satisfied first is the condition that's applied.
- In the Badge Type field, select Static.
- Add the thresholds. For each threshold, specify the badge color, operator, threshold value and short text.
-
-
Set the Status field to Active.
- Click Create to save the configuration.
- Note the number of the visualization configuration on the list page.
Create the Metric Card with the Visualization
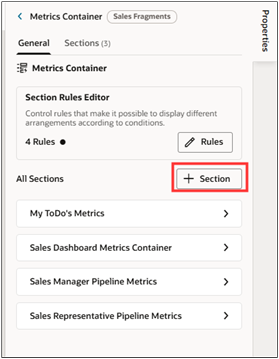
Click the Add Section button in the Metrics Container Properties section.
-
Click New Section at the top of the list.
Important: Although VB Studio allows it, you can't duplicate the metric cards provided by Oracle. You must create your own by adding a new section. -
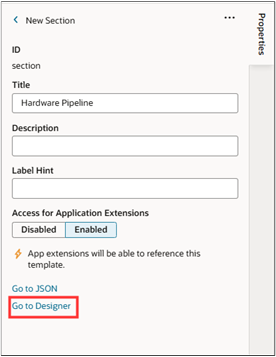
In the Properties, enter a title that's visible only during setup. For example, enter Hardware Pipeline. The title you enter here isn't the tab title that appears on the sales dashboard page. The runtime title comes from the visualization you created.
Click the Go to Designer link.
Click Code.
-
Your new Hardware Pipeline section displays empty placeholder
templatetags. For example:<template id="salesManagerHardwarePipelineMetrics"> </template> -
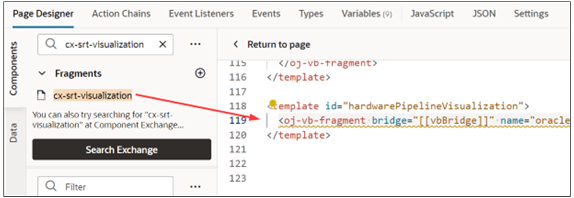
On the Components palette, in the Filter field, enter
cx-srt-visualization. Drag and drop the cx-srt-visualization fragment to the editor, between the template tags.
-
Add the following class information
class="oj-flex
                            oracle-cx-fragmentsUI-cx-fragment-full-height"
to the <oj-vb-fragment line before the > tag.<oj-vb-fragment bridge="[[vbBridge]]" name="oracle_cx_fragmentsUI:cx-visualization" class="oj-flex oracle-cx-fragmentsUI-cx-fragment-full-height"> -
Below the bridge parameter and before the </oj-vb-fragment> tag, add the following fragment parameter. Enter the number of the visualization you created in the value parameter.
<oj-vb-fragment-param name="reportNumber" value="6001"></oj-vb-fragment-param> -
Add the following parameters:
<oj-vb-fragment-param name="context"
      value='{"mode": "dashboard","source":"DV", "slot": "metric"}'></oj-vb-fragment-param>
    <oj-vb-fragment-param name="filter" value="[[ $base.page.variables.dashboardFilters ]]"></oj-vb-fragment-param>
  </oj-vb-fragment>
Your finished code will look like this:
<template id="hardwarePipeline"> <oj-vb-fragment bridge="[[vbBridge]]" name="oracle_cx_fragmentsUI:cx-visualization" class="oj-flex oracle-cx-fragmentsUI-cx-fragment-full-height"> <oj-vb-fragment-param name="reportNumber" value="6001"></oj-vb-fragment-param> <oj-vb-fragment-param name="context" value='{"mode": "dashboard","source":"DV", "slot": "metric"}'></oj-vb-fragment-param> <oj-vb-fragment-param name="filter" value="[[ $base.page.variables.dashboardFilters ]]"></oj-vb-fragment-param> </oj-vb-fragment> </template> - You can preview your changes by clicking the Preview button.
- Click Return to Page.
You're now ready to configure the content container for the tab as described in the topic Create the Contents Container and Link It to the Metric Card.