Create a Metric Card Directly in VB Studio
Instead of first creating the metric card contents as a visualization (the preferred method), you can create the whole metric card directly in Oracle Visual Builder Studio. Here's an example of creating a metric card with the sum of opportunities from a saved search.
Create the Metric Card
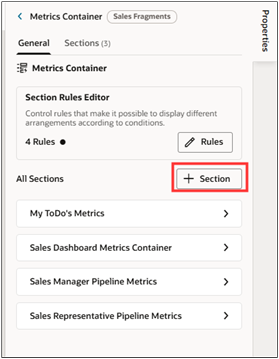
Click Add Section in a metrics container copy. (The button is the plus sign highlighted in the screenshot).
-
Click New Section at the top of the list.
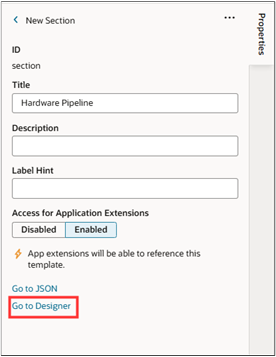
Important: Although VB Studio makes it possible to duplicate the metric cards provided by Oracle, you must instead add a new section, even if you're making a small change. You can't duplicate sections. - In the Create Section window, enter a title that's visible only during setup. You'll enter the actual tab title as a parameter in the code. For example, enter Sales Manager Hardware Pipeline.
Click the Go to Designer link.
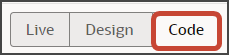
Click Code.
-
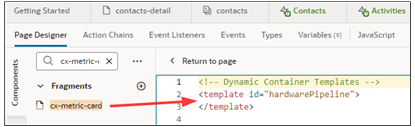
Your new Sales Manager Hardware Pipeline section displays empty placeholder
templatetags.<template id="salesManagerHardwarePipelineMetrics"> </template> -
On the Components palette, in the Filter field, enter
cx-metric-card. -
Drag and drop the cx-metric-card fragment to the template editor, between the template tags.
You action inserts the following code:
<oj-vb-fragment bridge="[[vbBridge]]" name="oracle_cx_fragmentsUI:cx-metric-card"></oj-vb-fragment> -
Add the following class information to the fragment:
class="oj-flex oracle-cx-fragmentsUI-cx-fragment-full-height.The resulting code looks like this:<oj-vb-fragment bridge="[[vbBridge]]" name="oracle_cx_fragmentsUI:cx-metric-card" class="oj-flex oracle-cx-fragmentsUI-cx-fragment-full-height></oj-vb-fragment> -
Insert the following code for the metric card before the
</oj-vb-fragment>tag-
Add the required resource parameter, which identifies the business object. The resource parameter is different for each object.
Here's the resource parameter for opportunities, the object for pipeline information:
<oj-vb-fragment-param name="resource" value='[[ {"name": "opportunities", "primaryKey": "OptyId", "puid": "OptyNumber", "endpoint": "cx" } ]]'></oj-vb-fragment-param>For other supported business objects, see the list of resource parameters in Values to Use in Code for Standard Components in Tables, Metric Cards, and List Views.
-
Add the required query parameter, which specifies the saved search that's the source of your data.
In this example, the source is a saved search with the ID
caf84b9d-b975-4b9d-b78e-41718b78f36e. You can obtain the ID of saved searches by inspecting the code in the Chrome browser as described the topic How can I find the UUIDs for a saved search and the IDs for its filters in Oracle Sales in the Redwood User Experience?.<oj-vb-fragment-param name="query" value='[[ [{"type": "savedSearch", "params": [{"key": "queryUuid", "value": "caf84b9d-b975-4b9d-b78e-41718b78f36e"}]}, ] ]]'></oj-vb-fragment-param> -
Optionally, you can filter the data from your source. For example, the sample parameters here filter the data to include only open opportunities owned by a manager's subordinates.
Tip: The saved search may already include filters, so you might want to add filters there instead of having another place to update in the future.<oj-vb-fragment-param name="query" value='[[ [{"type": "savedSearch", "params": [{"key": "queryUuid", "value": "caf84b9d-b975-4b9d-b78e-41718b78f36e"}]}, {"type": "qbe", "params": [{"key": "StatusCode", "operator": "in", "value": ["OPEN"] }, {"key": "RecordSet", "value": "ORA_MYSUBORDSSALESTEAMOPTIES" }]}, ] ]]'></oj-vb-fragment-param> -
Optionally, add badges that draw attention to critical information, as described in the section Add Badges to the Metric Card.
-
Add the title parameter with the title that displays on the tab.
<oj-vb-fragment-param name="titleItem" value="[['Hardware Pipeline']]"></oj-vb-fragment-param> -
To display the sum on the tab, add the aggregate parameter to calculate it. In this example, the parameter calculates the sum of the opportunity revenue in the saved search:
<oj-vb-fragment-param name="aggregate" value="[[ {'field': 'PrimaryRevenue.RevnAmount','functionType': 'sum' } ]]"></oj-vb-fragment-param>
Here's sample code for the opportunity saved search without the optional filters and badges:
<template id="salesManagerHardwarePipelineMetrics"> <oj-vb-fragment bridge="[[vbBridge]]" name="oracle_cx_fragmentsUI:cx-metric-card" class="oj-flex oracle-cx-fragmentsUI-cx-fragment-full-height"> <oj-vb-fragment-param name="resource" value='[[ {"name": "opportunities", "primaryKey": "OptyId", "puid": "OptyNumber", "endpoint": "cx" } ]]'></oj-vb-fragment-param> <oj-vb-fragment-param name="query" value='[[ [{"type": "savedSearch", "params": [{"key": "queryUuid", "value": "caf84b9d-b975-4b9d-b78e-41718b78f36e"}]}, ] ]]'></oj-vb-fragment-param> <oj-vb-fragment-param name="aggregate" value="[[ {'field': 'PrimaryRevenue.RevnAmount','functionType': 'sum' } ]]"></oj-vb-fragment-param> <oj-vb-fragment-param name="titleItem" value="[['Hardware Pipeline']]"></oj-vb-fragment-param> </oj-vb-fragment> </template> -
- Click Return to Page.
Add Badges to the Metric Card
First, determine the display conditions. Each condition is a range of aggregate sum numbers that display on the metric card. For each range, you decide which type of badge to display. For example, you can configure this type of setup:
-
If fewer than 5 overdue tasks exist, then don't show a badge at all.
-
If 5-10 overdue tasks exist, then show a warning badge.
-
If more than 10 overdue tasks exist, then show a critical badge.
When you define the display conditions for a metric card, the order of those conditions is important. Each condition is evaluated in the order in which you define them, from top to bottom. Whichever condition is satisfied first is the condition that's applied.
You can also configure the metric card so that the card always displays the same badge regardless of the aggregate sum on the card.
The following table lists the badge properties that you can use to define a set of badges and display conditions:
| Badge Property | Description |
|---|---|
|
|
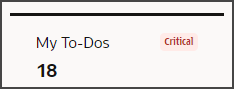
Each type of badge ( Here's an example of a "danger" badge with the text "Critical":
|
|
|
Lower limit of the display condition for a specific badge. |
|
|
Upper limit of the display condition for a specific badge. |
|
|
Text that displays on the badge. Each type of badge
( |
Here's a sample of the code that you can use to define a set of badges and display conditions:
[{status : "success", text : "All Good", min : "0", max : "10"}, {status : "warning", text : "Attention", min : "11", max : "50"},{status : "danger", text : "Critical", min : "51"}]-
Specify the type of badge to display (
status). -
Define the conditions (
minandmax) that display each badge and an optional description. -
Indicate the badge text (
text), for example, Warning or Problem.
-
You can specify only a lower limit without an upper limit (to indicate an aggregate sum that's greater than 10, for example).
-
You can add
metaTextwithout any range conditions. So, if none of the ranges apply, then show a description on the metric card.