Create a Chart from the Default Saved Search
You can save time when you select Default as your saved search in the Create Configuration page. That's because selecting the default saved search as your source, makes it possible for you to change the filters directly in the Visualization Configuration tool. Entering filters directly, eliminates the need for you to create and manage a specific saved search for each visualization.
- Navigate to .
- Click Visualization Configuration in the right-hand pane.
-
In the Visualization Configurations page, click Add.
-
From the Create Configuration page, Source Type field, select the Adaptive Search.
- Select the object.
-
Leave the Saved Search field set to Default. This selection specifies to use the default saved search for the object.
-
In the Visualization Type field, choose the visualization type, such as a bar chart, pie chart, donut chart, combo chart, metric card (KPI) and so on.
In the Details section, enter the dimensions and other preferences for the visualization. Which attributes are available depends on the type of visualization you're creating.
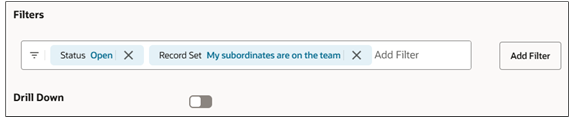
Important: Only attributes that have been enabled for Group By in Adaptive Search are available for selection as your chart axes. For details, see the topic How do I enable the filtering of visualizations by team members?.The Filter bar initially displays the filters in the default saved search. You can update or delete these filters and add your own filters.
You can make it possible for salespeople to specify filter values in the chart for a maximum of 2 filters:
- Click the filter.
Select the Prompted option.
 Restriction: Only filters that source data from a list of values or lookups can be marked as prompted.
-
Enable salespeople to drill down to the list page by turning on Drill Down.
When salespeople click one of the sections of the chart, the application displays a drill down page with a list of the records in that section. The columns are provided by the default saved search.
- The Settings section lets you change the orientation of chart, stacking, and the inclusion of a grand total. You can also specify the data label position, along with Grand Total for both Adaptive Search and OTBI based visualizations
- Set the Status field to Active.
- Click Create to save the configuration.
- Note the number of the visualization configuration on the list page. You'll use the number to include the visualization in the Sales Dashboard.