Entries for a Sample Revenue Bar Chart Visualization Created from Adaptive Search
Here are the entries to create a sample bar chart visualization from Adaptive Search. The chart shows the revenue by opportunity team member for the last year, this year, last quarter, and this quarter.
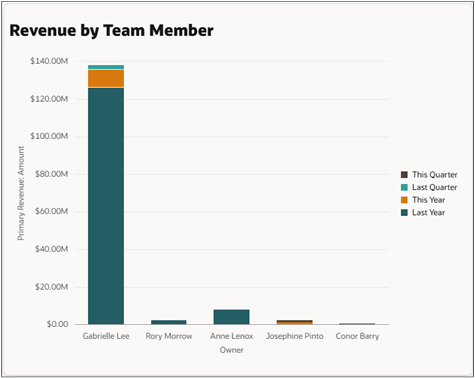
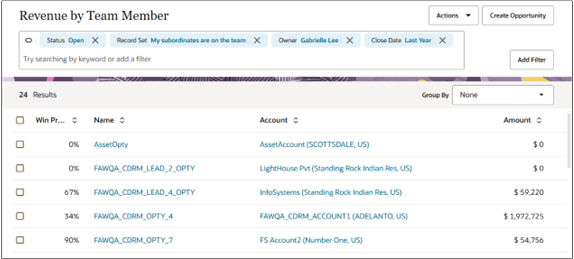
Clicking on last year's section for one of the team members opens a list page with the team member and last year's filters added. The list page includes the title of the visualization.
Here are sample entries to create the chart:
| Field Name | Entry | Description |
|---|---|---|
| Source Type | Adaptive Search | Visualization source. |
| Object | Opportunities | Business object |
| Saved Search | Default | The visualization uses the default saved search as the source of your information and lets you change the filters. |
| Name | Revenue by Team Member | The title of your visualization and the drill down page. |
| Visualization Type | Bar Chart | Different visualizations require different attributes. |
| X Axis | Owner | Displays owner names along the x-axis |
| Categorized By | Close Date | The quarter in which the close date appears. Because Stacked Layout is selected, the quarters appear as sections of each owner's bar. |
| Value | Primary Revenue Amount | Opportunity revenue |
| Format | Currency | Supplies currency symbol. Click the Preferences button to see this option. |
| Unit | Round Even | Rounding. |
| Aggregation | Sum | Type of calculation. |
| Orientation | Vertical | Bar chart orientation. |
| Stacked Layout | On | Displays the different quarters as sections on a bar. If off, you get separate bars for each time period for each team member. |
| Filters | Status: Open, Record Set: My subordinates are on the team |
Filters come from the default saved search, but you can change them. You can mark up to 2 filters as prompted. Only filters that source data from a list of values or lookups can be marked as prompted. |
| Drill Down | On | Enables drill-down. |