Create a Table from the Default Saved Search
Here's how to create a table when you select Default as your saved search. Making this selection makes it possible for you to add the filters in the visualization itself.
- Navigate to .
- Click Visualization Configuration in the right-hand pane.
-
In the Visualization Configurations page, click Add.
-
From the Create Configuration page, Source Type field, select the Adaptive Search.
- Select the object.
-
Leave the Saved Search field set to Default.
-
In the Visualization Type field, select Tabular Chart.
In the Columns section, use the Add Column list to add the columns you'd like to display in the table. The table builds as you add columns.
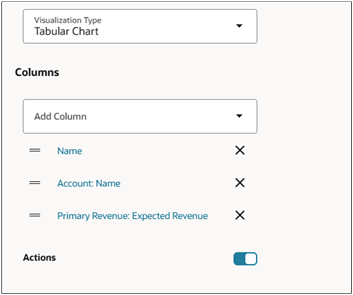
- Turn on Actions to display the Actions list (three dot icon) on each record in the table.
- Click the column name link to format the columns in the table and to specify the
drill down destination:
- In the Preferences drawer Format field, add any required format for the column. For example, to add the currency symbol, select Currency.
- Click Drill Down to enable drill down from the column.
Select the page you want to open. For example, to open the opportunity details page, select opportunities.
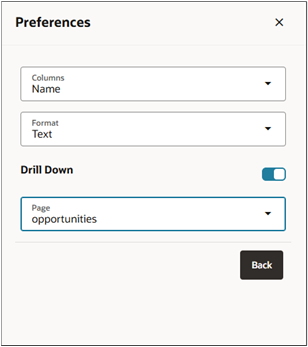
- Click Back.
In the Filter field, specify the filters for the table. The field initially displays the filters in the default saved search, but you can update, delete, and add filters.

-
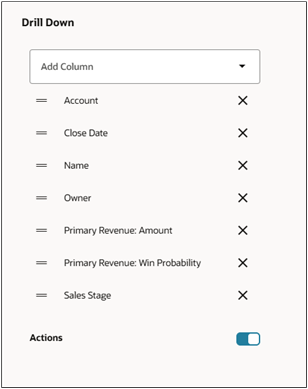
In the Drill Down section, use the controls to specify which columns you want to display in the list page that opens when users click the View All link at the bottom of the table.
Initially, the application lists the columns provided by the default saved search.
-
You can display the Actions menu on each record in the list by switching on Actions.
- Set the Status field to Active.
- Click Create to save the configuration.
- Note the number of the visualization configuration on the list page. You'll use the number to include the visualization in the Sales Dashboard.