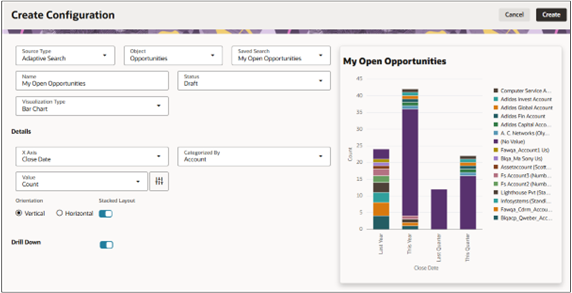
Create a Chart from a Specific Saved Search
You can create a table or a chart visualization from a specific saved search. This visualization type inherits the filters and the columns specified in the saved search. When users drill down on a section of the chart, they're directed to the page showing the saved search in the list page with the additional filter. When they click the View All link they see the list page for the saved search.
-
Make sure that the data in the saved search is visible to the user performing this configuration. You can temporarily remove filters from saved searches to ensure you see data.
- Navigate to .
- Click Visualization Configuration in the right-hand pane.
-
In the Visualization Configurations page, click Add.
From the Create Configuration page, Source Type field, select the Adaptive Search.

- Select the object.
-
In the Saved Search field, select the saved search.
-
In the Visualization Type field, choose your preferred visualization, such as a bar chart, pie chart, donut chart, and so on.
-
In the Details section, enter the dimensions and other preferences for the visualization. Which attributes are available depends on the type of visualization you're creating. The values you can enter in the attributes depend on your Adaptive Search setup.
Important: Only attributes that have been enabled for Group By in Adaptive Search are available for selection as your chart axes. For details, see the topic How do I enable the filtering of visualizations by team members? -
Enable salespeople to drill down to the list page from sections of the chart. Turn on Drill Down.
-
Set the Status field to Active.
- Click Create to save the configuration.
- Note the number of the visualization configuration on the list page. You'll need it when you add the visualization to the tab contents.