Key Performance Indicators (KPIs)
In the metric cards that form the top of each tab, you can display Key Performance Indicators (KPIs) that highlight critical values such as total amounts of pipeline revenue, closed revenue, or the number of overdue tasks. The KPIs provide an at-a-glance view of performance against goals and help salespeople prioritize actions quickly.
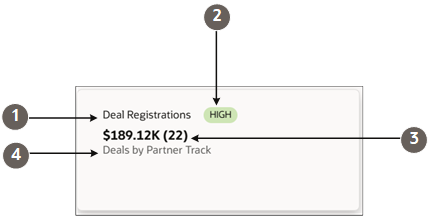
A metric card can have up to 5 different elements highlighted in the screenshot.
| Callout | Field | Description |
|---|---|---|
| 1 | Name |
The title of your dashboard tab. |
| 2 | Badge |
Displays badges you specify for different value ranges. |
| 3 | Primary Metric (Secondary Metric) |
You can display up to 2 metrics. In this example, it's the sum of the Deal Size (Primary Metric) and the count (Secondary Metric). |
| 4 | Description | One-line description that you enter or that's filled in dynamically. |
What Tools to Use to Create KPIs
Use the Visualization Configuration tool to configure KPIs from Adaptive Search saved searches or from OTBI analyses.Create the Metric Card for the Top of the Tab.
You can also create KPIs by entering a query in the sales dashboard Ask Oracle bar. See the topic: Create a Chart or a KPI from a Prompt. The AI agent creates simple KPIs that don't include badges, secondary metrics, or descriptions. You can add these in the Visualization Configuration tool.
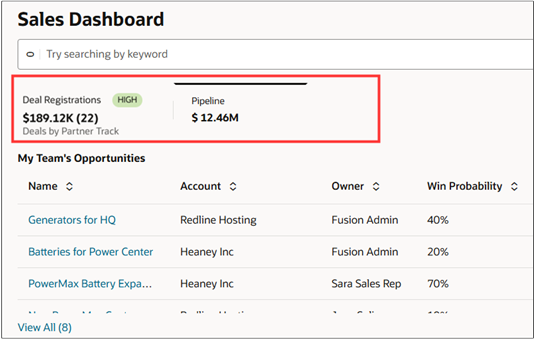
KPIs Appear as Tabs in the Sales Dashboard
Here's a screenshot of a sample dashboard with 2 tabs. The screenshot highlights the part the tabs defined by metric cards.