Tables
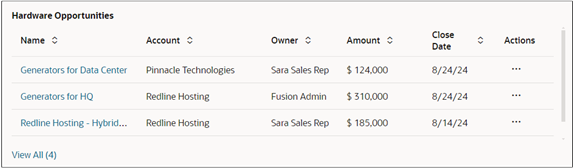
Tables in the sales dashboard present structured sales information, such as opportunities, accounts, or tasks in rows and columns, making it easy to scan, compare, and drill down into record-level details. Users can take smart actions directly from tables, to update records and follow up on opportunities, for example.
What Tools to Use to Create Tables
Use the Visualization Configuration tool to create tables from Adaptive Search saved searches or from OTBI analyses.
For personalization, you can also create a table by entering a query in the sales dashboard Ask Oracle bar and click the Visualize selection. See the topic: Create a Chart or a KPI from a Prompt.