Example of Multiechelon Replenishment Planning
This topic provides an example of multiechelon replenishment planning for an item in a supply chain with a source location and two destination locations.
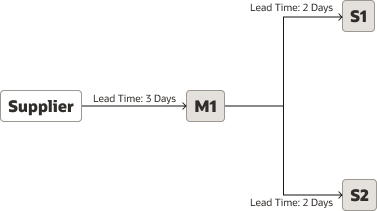
These are the details of the supply chain:
- The source location is M1 and gets its supply from a supplier.
- The lead time for M1 is 3 days. The lead time is considered as a
constraint.
However, the supplier capacity isn't considered as a constraint.
- M1 has two destination locations named S1 and S2.
The lead time for S1 and S2 is 2 days.
- The applicable policy type is min-max planning.
The following figure depicts this supply chain:
As is evident from the example, the logic for recommending unconstrained planned orders in multiechelon replenishment planning is the same as the logic for recommending planned orders in a replenishment plan that doesn't use the functionality for multiechelon replenishment planning.
Unconstrained, Bottom-Up Phase
The following table provides the measure values for S1 during the unconstrained, bottom-up phase:
| Measure | 01/01 | 01/02 | 01/03 | 01/04 | 01/05 | 01/06 | 01/07 | 01/08 | 01/09 | 01/10 | 01/11 | 01/12 | 01/13 | 01/14 | 01/15 |
|---|---|---|---|---|---|---|---|---|---|---|---|---|---|---|---|
| Gross Forecast | 10 | 8 | 11 | 19 | 10 | 8 | 11 | 10 | 8 | 11 | 10 | 9 | 10 | 8 | 8 |
| On Hand | 25 | – | – | – | – | – | – | – | – | – | – | – | – | – | – |
| Transfer Orders | – | – | 40 | – | – | – | – | – | – | – | – | – | – | – | – |
| Total Supply | 25 | – | 40 | – | – | 43 | – | – | – | 39 | – | – | – | 38 | – |
| On Order | 40 | 40 | – | – | 43 | – | – | – | 39 | – | – | – | 38 | – | – |
| Projected Available Balance | 15 | 7 | 36 | 17 | 7 | 42 | 31 | 21 | 13 | 41 | 31 | 22 | 12 | 42 | 34 |
| Beginning Inventory Position | 55 | 47 | 36 | 17 | 50 | 42 | 31 | 21 | 52 | 41 | 31 | 22 | 50 | 42 | 34 |
| Unconstrained Planned Orders by Order Date | – | – | – | 43 | – | – | – | 39 | – | – | – | 38 | – | – | – |
| Unconstrained Planned Orders by Due Date | – | – | – | – | – | 43 | – | – | – | 39 | – | – | – | 38 | – |
| Minimum Quantity | 30 | 30 | 30 | 30 | 30 | 30 | 30 | 30 | 30 | 30 | 30 | 30 | 30 | 30 | 30 |
| Maximum Quantity | 60 | 60 | 60 | 60 | 60 | 60 | 60 | 60 | 60 | 60 | 60 | 60 | 60 | 60 | 60 |
Note these points about S1:
- Unconstrained planned orders are recommended on 01/04, 01/08, and 01/12 when the value of the Beginning Inventory Position measure goes below 30 units. The unconstrained planned orders are the units necessary to bring the value of the Beginning Inventory Position measure up to 60 units. These unconstrained planned orders are reflected by the values of the Unconstrained Planned Orders by Order Date measure for 01/04, 01/08, and 01/12.
- After the lead time is considered, the unconstrained planned orders are reflected by the Unconstrained Planned Orders by Due Date measure for 01/06, 01/10, and 01/14.
The following table provides the measure values for S2 during the unconstrained, bottom-up phase:
| Measure | 01/01 | 01/02 | 01/03 | 01/04 | 01/05 | 01/06 | 01/07 | 01/08 | 01/09 | 01/10 | 01/11 | 01/12 | 01/13 | 01/14 | 01/15 |
|---|---|---|---|---|---|---|---|---|---|---|---|---|---|---|---|
| Gross Forecast | 9 | 11 | 9 | 11 | 15 | 10 | 9 | 12 | 11 | 10 | 9 | 12 | 10 | 8 | 12 |
| On Hand | 21 | – | – | – | – | – | – | – | – | – | – | – | – | – | – |
| In Transit | – | 45 | – | – | – | – | – | – | – | – | – | – | – | – | – |
| Total Supply | 21 | 45 | – | – | – | – | 54 | – | – | – | 42 | – | – | – | 41 |
| On Order | 45 | – | – | – | – | 54 | – | – | – | 42 | – | – | – | 41 | – |
| Projected Available Balance | 12 | 46 | 37 | 26 | 11 | 1 | 46 | 34 | 23 | 13 | 46 | 34 | 24 | 16 | 45 |
| Beginning Inventory Position | 57 | 46 | 37 | 26 | 11 | 55 | 46 | 34 | 23 | 55 | 46 | 34 | 24 | 57 | 45 |
| Unconstrained Planned Orders by Order Date | – | – | – | – | 54 | – | – | – | 42 | – | – | – | 41 | – | – |
| Unconstrained Planned Orders by Due Date | – | – | – | – | – | – | 54 | – | – | – | 42 | – | – | – | 41 |
| Minimum Quantity | 25 | 25 | 25 | 25 | 25 | 25 | 25 | 25 | 25 | 25 | 25 | 25 | 25 | 25 | 25 |
| Maximum Quantity | 65 | 65 | 65 | 65 | 65 | 65 | 65 | 65 | 65 | 65 | 65 | 65 | 65 | 65 | 65 |
Note these points about S2:
- Unconstrained planned orders are recommended on 01/05, 01/09, and 01/13 when the value of the Beginning Inventory Position measure goes below 25 units. The unconstrained planned orders are the units necessary to bring the value of the Beginning Inventory Position measure up to 65 units. These unconstrained planned orders are reflected by the values of the Unconstrained Planned Orders by Order Date measure for 01/05, 01/09, and 01/13.
- After the lead time is considered, the unconstrained planned orders are reflected by the Unconstrained Planned Orders by Due Date measure for 01/07, 01/11, and 01/15.
Recommendation of Constrained and Unconstrained Planned Orders at the Top-Most Echelon
The following table enables you to examine the constrained and unconstrained planned orders for M1:
| Measure | 01/01 | 01/02 | 01/03 | 01/04 | 01/05 | 01/06 | 01/07 | 01/08 | 01/09 | 01/10 | 01/11 | 01/12 | 01/13 | 01/14 | 01/15 |
|---|---|---|---|---|---|---|---|---|---|---|---|---|---|---|---|
| Unconstrained Planned Order Demand | – | – | – | 43 | 54 | – | – | 39 | 42 | – | – | 38 | 41 | – | – |
| Transfer Order Demand | 40 | – | – | – | – | – | – | – | – | – | – | – | – | – | – |
| On Hand | 55 | – | – | – | – | – | – | – | – | – | – | – | – | – | – |
| In Transit | – | 66 | – | – | – | – | – | – | – | – | – | – | – | – | – |
| Total Supply | 55 | 66 | – | – | – | – | 102 | – | – | – | 93 | – | – | – | 80 |
| On Order | 66 | – | – | – | 102 | 102 | – | – | 93 | 93 | – | – | 80 | 80 | – |
| Projected Available Balance | 15 | 81 | 81 | 38 | –16 | –16 | 86 | 47 | 5 | 5 | 98 | 60 | 19 | 19 | 99 |
| Beginning Inventory Position | 81 | 81 | 81 | 38 | 86 | 86 | 86 | 47 | 98 | 98 | 98 | 60 | 99 | 99 | 99 |
| Unconstrained Planned Orders by Order Date | – | – | – | 102 | – | – | – | 93 | – | – | – | 80 | – | – | – |
| Unconstrained Planned Orders by Due Date | – | – | – | – | – | – | 102 | – | – | – | 93 | – | – | – | 80 |
| Constrained Planned Orders | – | – | – | – | – | – | 102 | – | – | – | 93 | – | – | – | 80 |
| Minimum Quantity | 80 | 80 | 80 | 80 | 80 | 80 | 80 | 80 | 80 | 80 | 80 | 80 | 80 | 80 | 80 |
| Maximum Quantity | 140 | 140 | 140 | 140 | 140 | 140 | 140 | 140 | 140 | 140 | 140 | 140 | 140 | 140 | 140 |
Note these points about M1:
- For every unconstrained planned order at S1 and S2, the corresponding demand has been created for M1 and is reflected by the Unconstrained Planned Order Demand measure.
- Unconstrained planned orders are recommended on 01/04, 01/08, and 01/12 when the value of the Beginning Inventory Position measure goes below 80 units. The unconstrained planned orders are the units necessary to bring the value of the Beginning Inventory Position measure up to 140 units. These unconstrained planned orders are reflected by the values of the Unconstrained Planned Orders by Order Date measure for 01/04, 01/08, and 01/12.
- After the lead time is considered, the unconstrained planned orders are reflected by the Unconstrained Planned Orders by Due Date measure for 01/07, 01/11, and 01/15.
- The constrained planned orders that are recommended are reflected by the Constrained Planned Orders measure for 01/07, 01/11, and 01/15.
Constrained, Top-Down Phase
The following table enables you to examine the fulfillment of unconstrained planned order demands at M1:
| Measure | 01/01 | 01/02 | 01/03 | 01/04 | 01/05 | 01/06 | 01/07 | 01/08 | 01/09 | 01/10 | 01/11 | 01/12 | 01/13 | 01/14 | 01/15 |
|---|---|---|---|---|---|---|---|---|---|---|---|---|---|---|---|
| Unconstrained Planned Order Demand | – | – | – | 43 | 54 | – | – | 39 | 42 | – | – | 38 | 41 | – | – |
| Transfer Order Demand | 40 | – | – | – | – | – | – | – | – | – | – | – | – | – | – |
| On Hand | 55 | – | – | – | – | – | – | – | – | – | – | – | – | – | – |
| In Transit | – | 66 | – | – | – | – | – | – | – | – | – | – | – | – | – |
| Total Supply | 55 | 66 | – | – | – | – | 102 | – | – | – | 93 | – | – | – | 80 |
| On Order | 66 | – | – | – | 102 | 102 | – | – | 93 | 93 | – | – | 80 | 80 | – |
| Projected Available Balance | 15 | 81 | 81 | 38 | –16 | –16 | 86 | 47 | 5 | 5 | 98 | 60 | 19 | 19 | 99 |
| Beginning Inventory Position | 81 | 81 | 81 | 38 | 86 | 86 | 86 | 47 | 98 | 98 | 98 | 60 | 99 | 99 | 99 |
| Unconstrained Planned Orders by Order Date | – | – | – | 102 | – | – | – | 93 | – | – | – | 80 | – | – | – |
| Unconstrained Planned Orders by Due Date | – | – | – | – | – | – | 102 | – | – | – | 93 | – | – | – | 80 |
| Constrained Planned Orders | – | – | – | – | – | – | 102 | – | – | – | 93 | – | – | – | 80 |
| Constrained Planned Order Demand | – | – | – | 43 | – | – | 54 | 39 | 42 | – | – | 38 | 41 | – | – |
| Constrained On Order | 66 | – | – | 102 | 102 | 102 | – | 93 | 93 | 93 | – | 80 | 80 | 80 | – |
| Constrained Projected Available Balance | 15 | 81 | 81 | 38 | 38 | 38 | 86 | 47 | 5 | 5 | 98 | 60 | 19 | 19 | 99 |
| Constrained Beginning Inventory Position | 81 | 81 | 81 | 140 | 140 | 140 | 86 | 140 | 98 | 98 | 98 | 140 | 99 | 99 | 99 |
| Minimum Quantity | 80 | 80 | 80 | 80 | 80 | 80 | 80 | 80 | 80 | 80 | 80 | 80 | 80 | 80 | 80 |
| Maximum Quantity | 140 | 140 | 140 | 140 | 140 | 140 | 140 | 140 | 140 | 140 | 140 | 140 | 140 | 140 | 140 |
Note these points about M1:
- During the top-down pass, based on the constrained supply, a constrained planned order demand is created for every unconstrained planned order demand and stored in the Constrained Planned Order Demand measure.
- On 01/04, the value of the Constrained Projected Available Balance measure is 81
units and enough to meet the unconstrained planned order demand (43 units) for
that day. The value of the Constrained Projected Available Balance measure is 38
units (81 – 43) after this demand is met.
The value of the Constrained Planned Order Demand measure is 43 units for 01/04.
- On 01/05, the value of the Constrained Projected Available Balance measure is 38
units and insufficient to meet the unconstrained planned order demand (54 units)
for that day.
On 01/07, a constrained planned order of 102 units is received.
For this reason, the unconstrained planned order demand is met on 01/07, as reflected by the value of the Constrained Planned Order Demand measure for that day.
On 01/07, the value of the Constrained Projected Available Balance measure is 86 units (38 + 102 – 54).
- On 01/08, the value of the Constrained Projected Available Balance measure is 86
units and enough to meet the unconstrained planned order demand (39 units) for
that day. The value of the Constrained Projected Available Balance measure is 47
units (86 – 39) after this demand is met.
The value of the Constrained Planned Order Demand measure is 39 units for 01/08.
- On 01/09, the value of the Constrained Projected Available Balance measure is 47
units and enough to meet the unconstrained planned order demand (42 units) for
that day. The value of the Constrained Projected Available Balance measure is 5
units (47 – 42) after this demand is met.
The value of the Constrained Planned Order Demand measure is 42 units for 01/09.
- On 01/11, a constrained planned order of 93 units is received, which takes the value of the Constrained Projected Available Balance measure to 98 units (5 + 93).
- On 01/12, the value of the Constrained Projected Available Balance measure is 98
units and enough to meet the unconstrained planned order demand (38 units) for
that day. The value of the Constrained Projected Available Balance measure is 60
units (98 – 38) after this demand is met.
The value of the Constrained Planned Order Demand measure is 38 units for 01/12.
- On 01/13, the value of the Constrained Projected Available Balance measure is 60
units and enough to meet the unconstrained planned order demand (41 units) for
that day. The value of the Constrained Projected Available Balance measure is 19
units (60 – 41) after this demand is met.
The value of the Constrained Planned Order Demand measure is 41 units for 01/13.
The following table enables you to validate the creation of constrained planned orders at S1:
| Measure | 01/01 | 01/02 | 01/03 | 01/04 | 01/05 | 01/06 | 01/07 | 01/08 | 01/09 | 01/10 | 01/11 | 01/12 | 01/13 | 01/14 | 01/15 |
|---|---|---|---|---|---|---|---|---|---|---|---|---|---|---|---|
| Gross Forecast | 10 | 8 | 11 | 19 | 10 | 8 | 11 | 10 | 8 | 11 | 10 | 9 | 10 | 8 | 8 |
| On Hand | 25 | – | – | – | – | – | – | – | – | – | – | – | – | – | – |
| Transfer Orders | – | – | 40 | – | – | – | – | – | – | – | – | – | – | – | – |
| Total Supply | 25 | – | 40 | – | – | 43 | – | – | – | 39 | – | – | – | 38 | – |
| On Order | 40 | 40 | – | – | 43 | – | – | – | 39 | – | – | – | 38 | – | – |
| Projected Available Balance | 15 | 7 | 36 | 17 | 7 | 42 | 31 | 21 | 13 | 41 | 31 | 22 | 12 | 42 | 34 |
| Beginning Inventory Position | 55 | 47 | 36 | 17 | 50 | 42 | 31 | 21 | 52 | 41 | 31 | 22 | 50 | 42 | 34 |
| Unconstrained Planned Orders by Order Date | – | – | – | 43 | – | – | – | 39 | – | – | – | 38 | – | – | – |
| Unconstrained Planned Orders by Due Date | – | – | – | – | – | 43 | – | – | – | 39 | – | – | – | 38 | – |
| Constrained Planned Orders | – | – | – | – | – | 43 | – | – | – | 39 | – | – | – | 38 | – |
| Constrained On Order | 40 | 40 | – | 43 | 43 | – | – | 39 | 39 | – | – | 38 | 38 | – | – |
| Constrained Projected Available Balance | 15 | 7 | 36 | 17 | 7 | 42 | 31 | 21 | 13 | 41 | 31 | 22 | 12 | 42 | 34 |
| Constrained Beginning Inventory Position | 55 | 47 | 36 | 60 | 50 | 42 | 31 | 60 | 52 | 41 | 31 | 60 | 50 | 42 | 34 |
| Minimum Quantity | 30 | 30 | 30 | 30 | 30 | 30 | 30 | 30 | 30 | 30 | 30 | 30 | 30 | 30 | 30 |
| Maximum Quantity | 60 | 60 | 60 | 60 | 60 | 60 | 60 | 60 | 60 | 60 | 60 | 60 | 60 | 60 | 60 |
For S1, the due dates of the unconstrained planned orders are aligned with the dates of the constrained planned orders. Therefore, all the unconstrained planned orders have been met on time.
The following table enables you to validate the creation of constrained planned orders at S2:
| Measure | 01/01 | 01/02 | 01/03 | 01/04 | 01/05 | 01/06 | 01/07 | 01/08 | 01/09 | 01/10 | 01/11 | 01/12 | 01/13 | 01/14 | 01/15 |
|---|---|---|---|---|---|---|---|---|---|---|---|---|---|---|---|
| Gross Forecast | 9 | 11 | 9 | 11 | 15 | 10 | 9 | 12 | 11 | 10 | 9 | 12 | 10 | 8 | 12 |
| On Hand | 21 | – | – | – | – | – | – | – | – | – | – | – | – | – | – |
| In Transit | – | 45 | – | – | – | – | – | – | – | – | – | – | – | – | – |
| Total Supply | 21 | 45 | – | – | – | – | 54 | – | – | – | 42 | – | – | – | 41 |
| On Order | 45 | – | – | – | – | 54 | – | – | – | 42 | – | – | – | 41 | – |
| Projected Available Balance | 12 | 46 | 37 | 26 | 11 | 1 | 46 | 34 | 23 | 13 | 46 | 34 | 24 | 16 | 45 |
| Beginning Inventory Position | 57 | 46 | 37 | 26 | 11 | 55 | 46 | 34 | 23 | 55 | 46 | 34 | 24 | 57 | 45 |
| Unconstrained Planned Orders by Order Date | – | – | – | – | 54 | – | – | – | 42 | – | – | – | 41 | – | – |
| Unconstrained Planned Orders by Due Date | – | – | – | – | – | – | 54 | – | – | – | 42 | – | – | – | 41 |
| Constrained Planned Orders | – | – | – | – | – | – | – | – | 54 | – | 42 | – | – | – | 41 |
| Constrained On Order | 45 | – | – | – | – | – | 54 | 54 | 42 | 42 | – | – | 41 | 41 | – |
| Constrained Projected Available Balance | 12 | 46 | 37 | 26 | 11 | 1 | –8 | –20 | 23 | 13 | 46 | 34 | 24 | 16 | 45 |
| Constrained Beginning Inventory Position | 57 | 46 | 37 | 26 | 11 | 1 | 46 | 34 | 65 | 55 | 46 | 34 | 65 | 57 | 45 |
| Minimum Quantity | 25 | 25 | 25 | 25 | 25 | 25 | 25 | 25 | 25 | 25 | 25 | 25 | 25 | 25 | 25 |
| Maximum Quantity | 65 | 65 | 65 | 65 | 65 | 65 | 65 | 65 | 65 | 65 | 65 | 65 | 65 | 65 | 65 |
Note these points about S2:
- For every constrained planned order demand at M1, a corresponding constrained
planned order has been created at S2.
In functional terms, there are constrained, inbound (planned transfer) recommendations from M1 to S2. These recommendations are represented in the Supplies and Demands table as planned orders and get converted to transfer orders after being released.
- The constrained planned order on 01/09 at S2 is late by two days because of
constraints at M1.
So, the constrained projected available balance at S2 for 01/07 and 01/08 is negative.
On 01/07, the constrained projected available balance is –8 units (the previous day's value of 1 minus the gross forecast of 9).
On 01/08, the constrained projected available balance is –20 units (the previous day's value of –8 minus the gross forecast of 12).
- On 01/09, a constrained planned order of 54 units is received.
- On 01/09, the constrained projected available balance is 23 units (the previous day's value of –20 minus the gross forecast of 11 plus the constrained planned order of 54).